
Monetary Metals Supply and Demand Report: 22 Mar, 2015
This week, the price of gold was not moving much until Wednesday. And then, someone or other said something about monetary policy. And boom! Just like that, the price of everything took off like a rocket. By the end of the week, the price of gold was up $24 and the price of silver was up $1.09.
Is this it? The time when the money supply will rise and, at long last, take the prices of the monetary metals up with it? Or have we seen this headfake movie before?
For a picture of the supply and demand fundamentals of gold and silver, read on…
First, here is the graph of the metals’ prices.
The Prices of Gold and Silver
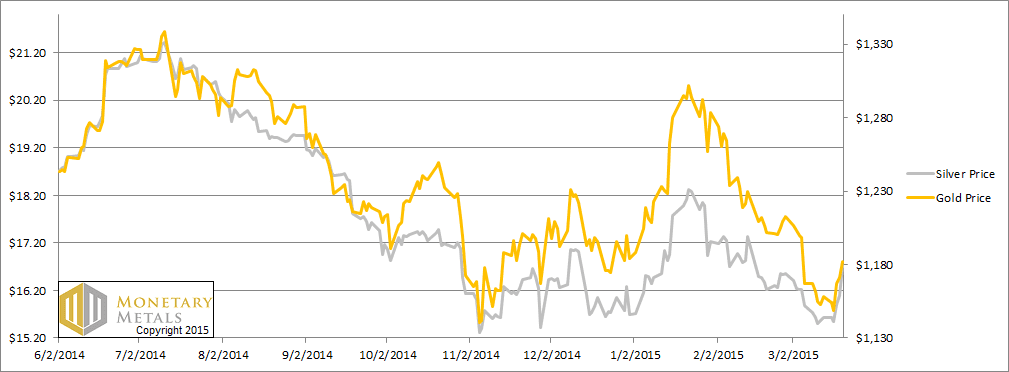
We are interested in the changing equilibrium created when some market participants are accumulating hoards and others are dishoarding. Of course, what makes it exciting is that speculators can (temporarily) exaggerate or fight against the trend. The speculators are often acting on rumors, technical analysis, or partial data about flows into or out of one corner of the market. That kind of information can’t tell them whether the globe, on net, is hoarding or dishoarding.
One could point out that gold does not, on net, go into or out of anything. Yes, that is true. But it can come out of hoards and into carry trades. That is what we study. The gold basis tells us about this dynamic.
Conventional techniques for analyzing supply and demand are inapplicable to gold and silver, because the monetary metals have such high inventories. In normal commodities, inventories divided by annual production (stocks to flows) can be measured in months. The world just does not keep much inventory in wheat or oil.
With gold and silver, stocks to flows is measured in decades. Every ounce of those massive stockpiles is potential supply. Everyone on the planet is potential demand. At the right price, and under the right conditions. Looking at incremental changes in mine output or electronic manufacturing is not helpful to predict the future prices of the metals. For an introduction and guide to our concepts and theory, click here.
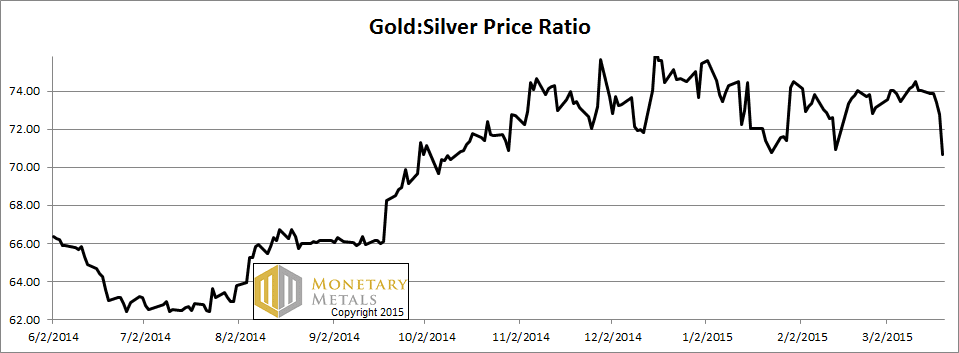
Next, this is a graph of the gold price measured in silver, otherwise known as the gold to silver ratio. It moved down hard this week. By technical analysis, one might be tempted to say it’s breaking down, now below the previous lows since late October.
The Ratio of the Gold Price to the Silver Price
For each metal, we will look at a graph of the basis and cobasis overlaid with the price of the dollar in terms of the respective metal. It will make it easier to provide brief commentary. The dollar will be represented in green, the basis in blue and cobasis in red.
Here is the gold graph.
The Gold Basis and Cobasis and the Dollar Price
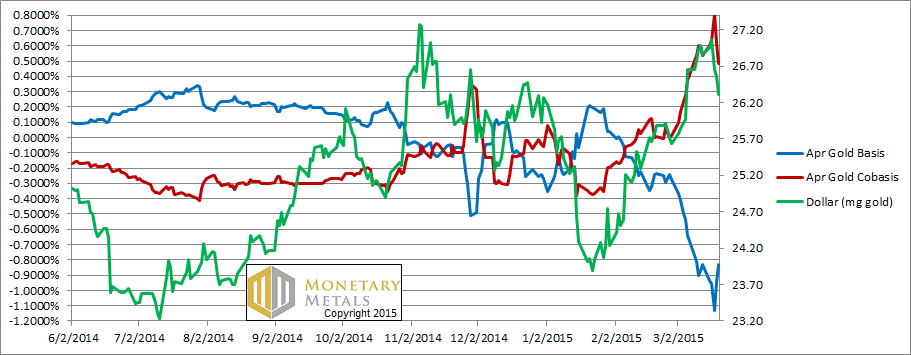
We continue to be astonished at the tight correlation between scarcity (the red line, i.e. cobasis) and the price of the dollar in gold (i.e. the inverse of the gold price in dollars). This correlation means that as gold gets more expensive (as it did this week), it becomes less scarce. As it becomes cheaper, it becomes scarcer.
If I were writing a textbook and needed an example of a series of price moves that were not driven by fundamental changes, this would be a good one. As speculators buy futures, they push up price and abundance. As they sell, they push them down.
The Federal Open Market Committee said some blahblahblah this week, and futures traders slammed their buy buttons like contestants on Jeopardy. And they did it, not just in gold, but in many asset classes (though not junk bonds, interestingly).
Our calculated fundamental price of gold dropped $20, though it’s still almost $100 over the current market price.
Now let’s look at silver.
The Silver Basis and Cobasis and the Dollar Price
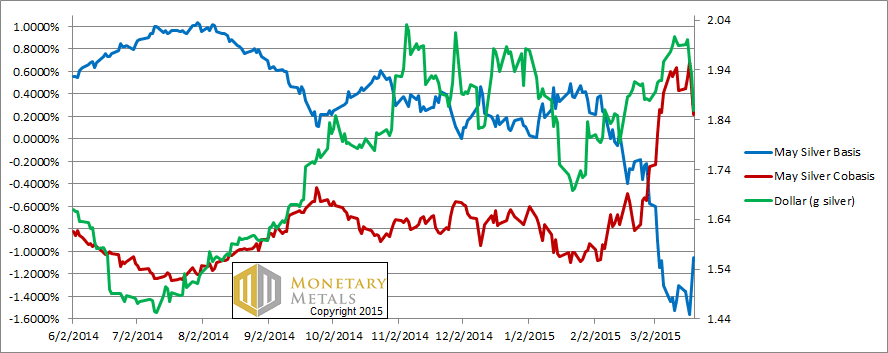
The pattern in silver is similar to gold, though the price of the dollar in silver terms fell more than did the scarcity. I.e. there was some buying of metal along with the buying of futures.
Our fundamental price for silver rose sharply this week, though alas, not as much as did the market price. The fundamental is still almost a buck below the market.
Given the long period of gold and silver price doldrums, and the obvious moves this week, we would not at all be surprised to see continued rising prices over the next week or so. However, particularly in silver, we would not bet on it because silver remains overpriced by our model.
© 2015 Monetary Metals

Hi Keith. Do you think the +/- 9tr. $ carry trade from foreign borrowers still has considerable unwinding to do ?
Keith,
Thank You ,Still trying to understand all this,Every time i read your,Monetary Metals Report
I think i get a little more each time,Please keep them coming.
Mike
Your methodology makes sense. It’s the source of the inputs that has me befuddled. The exchanges’ design weaknesses with regard to HFT, naked shorting, fails to deliver, naked sponsored access, etc., continually thwarting true price discovery. The mere appearance of high-volume asks (frequently with depth), eventhough quickly withdrawn, is enough to get a similar reaction from the other algol’s. Banging the bid at close is commonplace. Seems as though this action would taint our basis/cobasis data. N’est pas?
Thank you for the comments.
jmf: Good question. I don’t want to answer off the cuff, but I will note the interest rate in dollars is much higher than in yen, francs, or euros.
Freeman: The market maker is the trader who narrows the bid ask spread. He is the only one who buys at the bid and sells at the ask. Since his appearance in the coffee houses of London centuries ago, he has been regarded with suspicion if not a desire to banish him by law. He has not been well understood. Today, he is known as HFT. Not that HFT is all good, I wrote this last year: http://keithweinereconomics.com/2014/04/25/high-frequency-trading/
I believe I have written more than anyone to debunk allegations of gold market manipulation and naked shorting. It’s all on this site, just scroll backwards through the blog. Much of it was Feb 2013 through that summer, with additional articles spread throughout.
Keith,
The authorities have controlled the price of gold since the days of King Croesus. Why would they stop now?
Hello,
I just have a very simple question. Which spot price of gold and silver are you using as data in your model?
I am checking the spot price on Saxo Bank. It seems to me that both Basis and Cobasis are negative now…..which mean, there is no arbitrage trade.
And Would you like to make long history base chart base on your model?
I am very interesting to see that how the basis and cobasis change when the price went up since 2001.
Best regards
QF