
Monetary Metals Supply and Demand Report: 23 Feb, 2014
The dollar dropped a little more this week. Measured conventionally, the gold price rose six bucks and the silver price almost 40 cents. The question everyone should be asking: who is driving up the prices of the metals? Are they, yet again, leveraged speculators buying futures with up to 10:1 leverage? Or has the picture changed? Read on…
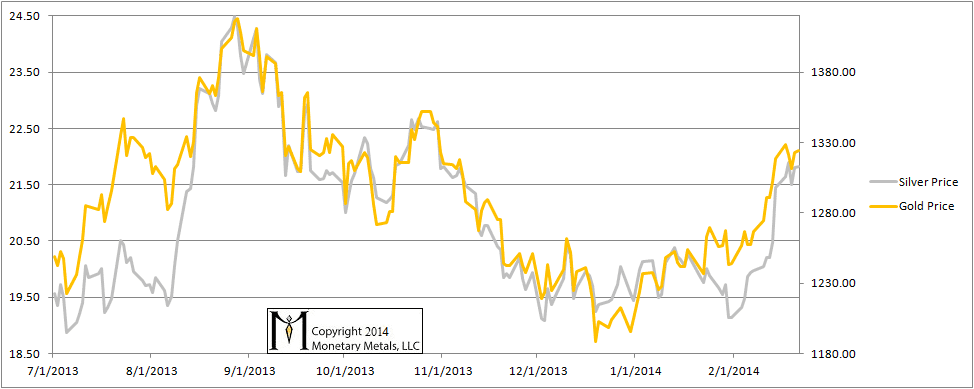
Here is the graph of the metals’ prices.
The Prices of Gold and Silver
We are interested in the changing equilibrium created when some market participants are accumulating hoards and others are dishoarding. Of course, what makes it exciting is that speculators can (temporarily) exaggerate or fight against the trend. The speculators are often acting on rumors, technical analysis, or partial data about flows into or out of one corner of the market. That kind of information can’t tell them whether the globe, on net, hoarding or dishoarding.
One could point out that gold does not, on net, go into or out of anything. Yes, that is true. But it can come out of hoards and into carry trades. That is what we study. The gold basis tells us about this dynamic.
Conventional techniques for analyzing supply and demand are inapplicable to gold and silver, because the monetary metals have such high inventories. In normal commodities, inventories divided by annual production can be measured in months. The world just does not keep much inventory in wheat or oil.
With gold and silver, stocks to flows is measured in decades. Every ounce of those massive stockpiles is potential supply. Everyone on the planet is potential demand. At the right price. Looking at incremental changes in mine output or electronic manufacturing is not helpful to predict the future prices of the metals. For an introduction and guide to our concepts and theory, click here.
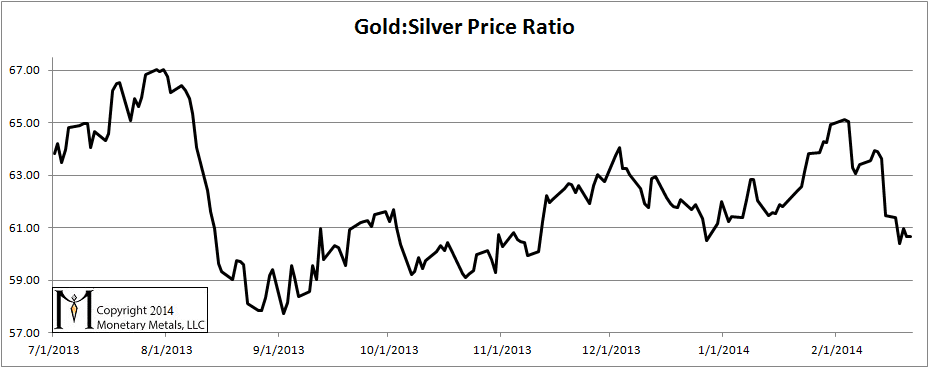
Here is a graph of the gold price measured in silver, otherwise known as the gold to silver ratio. The ratio fell again this week.
The Ratio of the Gold Price to the Silver Price
For each metal, we will look at a graph of the basis and cobasis overlaid with the price of the dollar in terms of the respective metal. It will make it easier to provide terse commentary. The dollar will be represented in green, the basis in blue and cobasis in red.
Here is the gold graph.
The Gold Basis and Cobasis and the Dollar Price
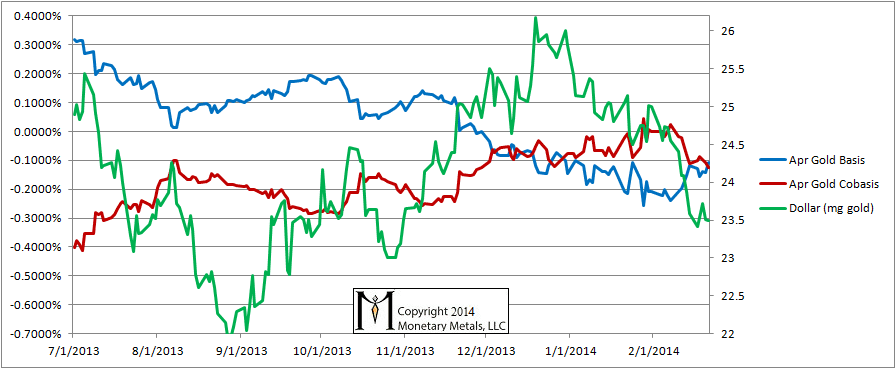
If we had to read it, we’d say that the cobasis fell disproportionately more than the dollar. It’s almost as if the rising price is discouraging purchases of metal and/or encouraging selling of it.
The speculators, of course, are not discouraged by high price though they are encouraged by rising price. Technical analysts are probably becoming more bullish with each dollar rise as gold takes out various moving averages and levels of resistance. On purely technical grounds, one could reasonably expect higher gold prices.
Now let’s look at silver.
The Silver Basis and Cobasis and the Dollar Price
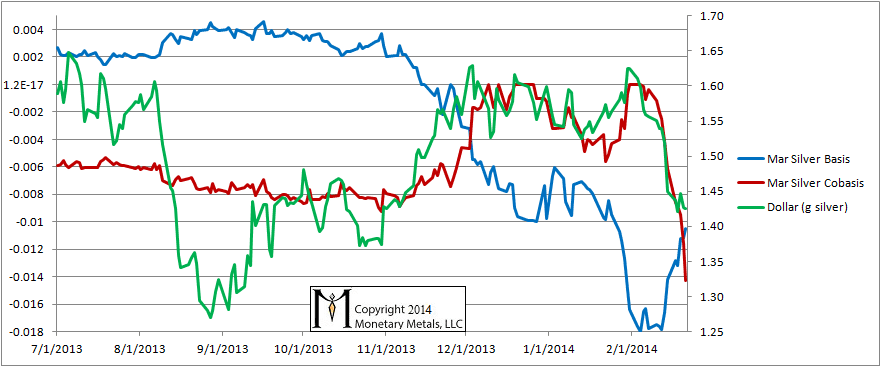
Look at that spectacular drop in the cobasis! And there is even a significant rise in the basis as well. This week alone, the number of open silver contracts for March dropped by almost 20,000, or about 30%.
These big moves in the bases are against the current of rolling the March contract. This close to First Notice Day, that current is strong indeed.
How much longer can speculators add more leverage to keep the silver price levitating? We don’t know. We just suggest extreme caution here.
very interesting work
since you track basis and cobasis on US futures markets do
you track the Chinese futures markets since that’s where all
the gold seems to be going. Or are the Americans actually allowing
all the gold to be bought by China. last report I read entire worlds production for the last year has gone to China.
Any comment appreciated
Keith – as Fekete stated in his April 2013 article Hydra, the FED is selling unlimited amount of gold futures through the bullion banks. Help me understand how your analysis of the basis/cobasis relationship accounts for the impact of these false signals to the market. Also, any comment on Sandeep’s departure from GSI?
And – if “selling unlimited futures” has no impact, why is the FED doing it? This may be obvious to everyone else, but I am still trying to adjust my thought process about this stuff.