
Monetary Metals Supply and Demand Report: 23 Nov, 2014
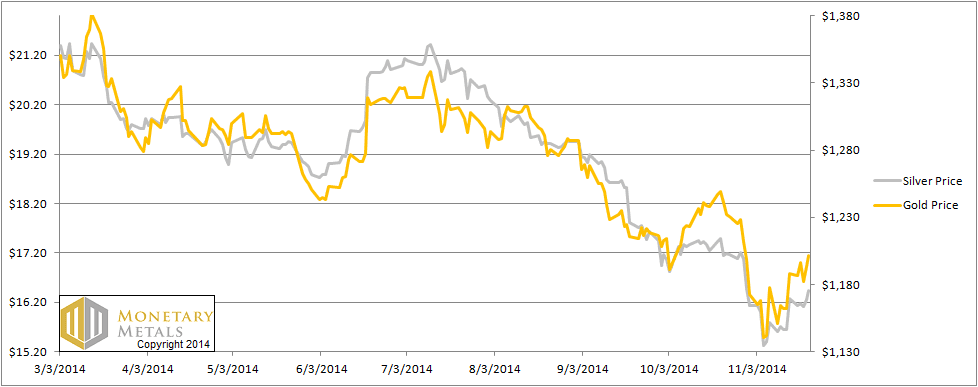
No fireworks this week, with the gold price ending +$13 from last week and the silver price ending +$0.15.
Some chartists (and of course the ever-bullish contingency) are calling for a bottom in gold and the price will soon resume its way up to $5,000 and limitless profits. We have a slightly different view. The price of the dollar has fallen over the past two weeks or so, from over 27¼ mg gold to its current level well under 26mg. Priced in silver, the dollar has fallen from over 2 grams to under 1.9g.
For our unique picture of the supply and demand fundamentals, read on…
First, here is the graph of the metals’ prices.
The Prices of Gold and Silver
We are interested in the changing equilibrium created when some market participants are accumulating hoards and others are dishoarding. Of course, what makes it exciting is that speculators can (temporarily) exaggerate or fight against the trend. The speculators are often acting on rumors, technical analysis, or partial data about flows into or out of one corner of the market. That kind of information can’t tell them whether the globe, on net, is hoarding or dishoarding.
One could point out that gold does not, on net, go into or out of anything. Yes, that is true. But it can come out of hoards and into carry trades. That is what we study. The gold basis tells us about this dynamic.
Conventional techniques for analyzing supply and demand are inapplicable to gold and silver, because the monetary metals have such high inventories. In normal commodities, inventories divided by annual production can be measured in months. The world just does not keep much inventory in wheat or oil.
With gold and silver, stocks to flows is measured in decades. Every ounce of those massive stockpiles is potential supply. Everyone on the planet is potential demand. At the right price, and under the right conditions. Looking at incremental changes in mine output or electronic manufacturing is not helpful to predict the future prices of the metals. For an introduction and guide to our concepts and theory, click here.
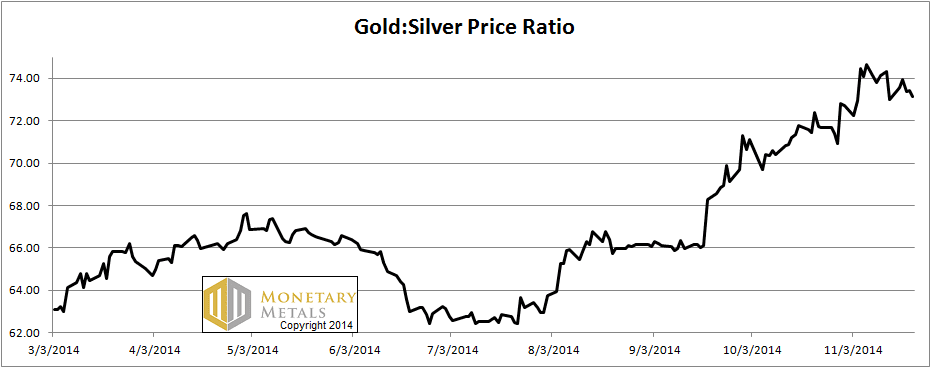
Next, this is a graph of the gold price measured in silver, otherwise known as the gold to silver ratio. It rose slightly this week.
The Ratio of the Gold Price to the Silver Price
For each metal, we will look at a graph of the basis and cobasis overlaid with the price of the dollar in terms of the respective metal. It will make it easier to provide terse commentary. The dollar will be represented in green, the basis in blue and cobasis in red.
Here is the gold graph.
The Gold Basis and Cobasis and the Dollar Price
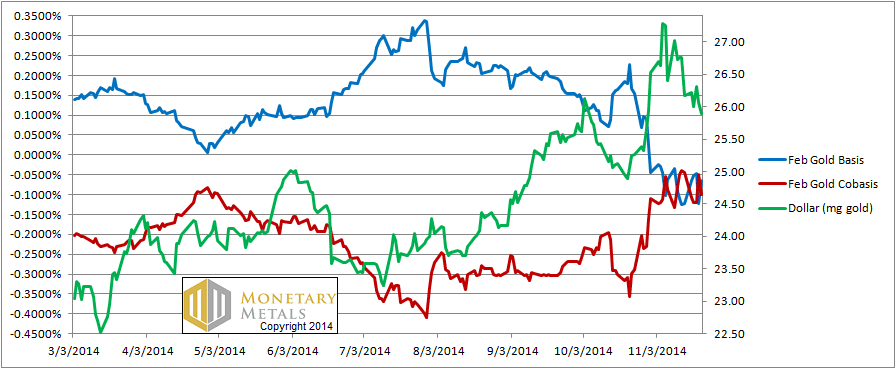
We moved from graphing the December bases to the February contract (see the discussion under silver below).
The dollar fell by over a quarter of a milligram this week. Did the buyers of metal finally come to the market, perhaps ahead of the Swiss gold initiative? Not quite. The cobasis (i.e. scarcity) fell. Not a lot, but it looks like the basis (i.e. abundance) and cobasis are in a range for the entire month of November, oscillating and out of phase with each other.
This is not the behavior we’d expect to see for a large and durable drop in the dollar (i.e. rise in the gold price). When that happens, the cobasis should be rising or at least not falling as the price moves.
The February basis is just below zero and the cobasis now stands at -0.1%. These are hardly normal readings, but not atypical in the post-2008 reality.
Let’s put this into perspective. Last week, we calculated a fundamental price of gold $72 over the market price. This week, the fundamental is still above market, but only by $50.
Now let’s look at silver.
The Silver Basis and Cobasis and the Dollar Price
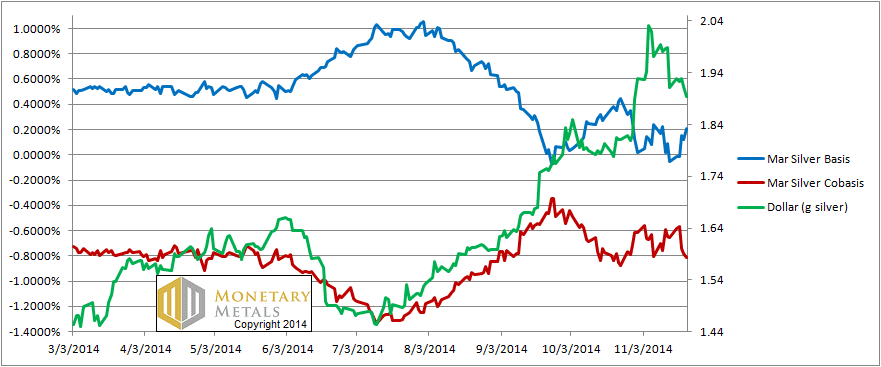
In silver, the market is not moving the way it is in gold. The gold cobasis is now slightly higher than it was on Nov 5. The silver cobasis is way below. The March cobasis currently stands below -0.8%. The basis is +0.2%.
As the dollar falls in terms of silver (i.e. the silver price rises) we just do not see any strength in the silver cobasis. It seems the silver hoarders haven’t yet got the message that the silver speculators have been getting for the last three years.
A continuation of the silver price rally of the past few weeks would not be surprising. But as with gold, we’d expect to see the cobasis behaving very differently if this is going to be a large and more importantly durable rally to $20 much less $50.
On the other hand, it wouldn’t surprise us to see the price drop a buck this week either. We wouldn’t bet either way at this point.
To provide the same perspective in silver, last week the fundamental price was 73 cents under the market price. This week, the fundamental price is $1.27 below.
We switched from watching the Dec contracts, to February in gold and March in silver. The graph below illustrates why, and also something else we talk about from time to time. Manipulation theories.
The December Silver Basis and Cobasis and the Dollar Price
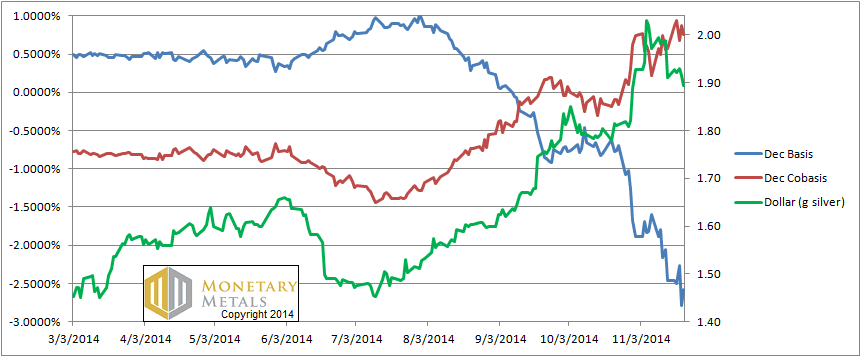
The December bases in silver give a very different picture than March. Cobasis is +1%, and basis has fallen off the chart into the abyss. It’s pretty, but it’s not an accurate picture of reality.
It is a picture of one-way pressure in the December contract. Selling pressure is relentless on the bid.
If the banks were naked short, they would have to relentlessly buy the contract before First Notice Day. Relentless buying would drive up the basis, as basis is future – spot. The opposite of what we see.
We see the result of naked longs and arbitraging banks: relentless selling. This pushes down the price of the future, especially the bid (the basis calculation depends on the bid on the future). That blue line shows a clear picture of this. Market makers bring down the ask price, which is why the red line is rising, but as we approach expiry the market makers become weaker as they close their positions and move on to the next contract.
In physics, theorists have endless debates about how certain really small or really far and distant things will behave. Once an experimentalist goes out and gets the data, the debate is settled. The gold and silver data is in. The bases do not behave in a way consistent with naked short selling. They behave consistently with banks as arbitragers. Make of it what you will, but please don’t put money in harm’s way based on manipulation theories (with due respect to Kevin O’Leary on Shark Tank).
Speaking of the Swiss gold initiative, Keith wrote an article that is somewhat critical of it.
© 2014 Monetary Metals
Keith,
the falling of the basis in the december contract means a lack of demand for it vs. the physical metal – hence the price difference between spot and future and the backwardation. How can you attribute the falling basis to naked longs selling? Can’t this just as well be shorts holidng contracts wanting to take delivery of metal to cover a short and simply lack of buying interest in the december future contract vs. the physical metal?
Fantastic analysis as usual and no doubt the most accurate record of where the gold price has been, and likely is going in the near future, but the funny thing is that although I want to buy gold I never feel encouraged to do so when I read your posts. Maybe I should just ignore everything and go with my gut feel that tells me to buy because who knows when that day will come when the unexpected happens, be it a war announcement in the Ukraine or the shadow banking system in China crashing or some country leaving the Eurozone or Japan imploding under it’s quadrillion yen of debt or Russia announcing that because of all the pressure on its currency that it is now backing it with gold. Perhaps on that day when the bid is $2,000.00 and no ask, perhaps on that day I may regret not having bought because I was worried about the cobasis. Are we not seeing the forrest for the trees ?
Anything positive regarding gold and especially silver ?
Nope, certainly not here !
The analysis of this website, even if correct, are fully dedicated to the actions of western futures speculators.
That’s why the conclusions here are always the same that what is described in technical analysis which are bearish for most of them on a medium and long term basis.
JD: I’ve seen many technical analysts call for a silver price breakout over the past few years. We’re not doing TA here.
I will be the first to trumpet skyrocketing prices. Just as soon as the supply and demand fundamentals change.
In the meantime, what would you rather have: confirmation or accuracy?
It is to the cave or to the moon : nothing between !
If you take some people with a strong bias for gold (for whatever the reasons) you would still find some bullish TA since april 2013 but in the whole analysts community such big banks and even people like financialsense most of them are bearish for quarters if not years…
Considering the fact that your analysis can all be considered as strong sell for monetary metals (especially silver I agree) I guess like sandeep jaitly that you are long T bonds and Procter and gamble stocks or prime real estate in London (very interesting at 30 000 USD a square meter as we are going to da moon at 100 000 USD) ! But in this case as him, it is time to search for a job in the city or wall street, no need to invoke the carl menger’s mighty spirit !
I would also be curious to know if your are looking for the bases in the shanghai gold exchange ?
RD: I said the fundamental price of gold is $50 over the market price. That’s hardly to the cave. Also, I rather suspect that Goldman’s reasons for why the gold price will go down differ from mine. ;)
I am on the record as saying interest rates will continue to fall. Although I don’t recall ever suggesting that anyone buy government bonds, that would be the obvious way to trade that thesis. I don’t recommend that for two reasons. One, I don’t want to feed the beast. Two, I don’t want to give investment advice.
Keith,
How can we square the current gold cobasis with the fact that the 1, 2, 3 and 6 month GOFO rates are in a greater state of backwardation this morning than they’ve been in the last 5 years?
Thanks
Foreknowledge will allow people to act in discord with the ‘expected’ path.
Thanks for your comments and questions.
Petter: The near-month contract departs from the farther months as it approaches expiry. So this is not lack of demands for futures per se, but lack of demand (and indeed massive selling) of one contract. Other contracts are not experiencing this selling. Regarding shorts, they do not get metal on delivery–they have to deliver metal. If they are naked, then that means they don’t have any metal. A naked short must cover his short before First Notice Day, i.e. buy the contract.
rutz: Broadly, I hope readers get three take-aways from the Supply and Demand Report:
1) the permabull arguments, manipulation theories, and mine supply vs. electronics demand approaches are not helpful to predict prices
2) the price of gold can go down as well as up, and there is a way to predict both
3) the paper currencies are collapsing, though this is not evident in consumer prices or the price of gold. Everyone should own some gold, because gold is the only financial asset that will survive when the backing for all other financial assets–the Treasury bond–fails
4) An increase in the gold price is not a gain–you have more dollars but each of them is worth proportionally less (not necessarily true with a gain in the silver price). One should measure the dollar, and everything else including your net worth, in gold.
miamonaco: I wrote an article in 2013 about GOFO and its correlation to the basis. I think it’s important to use a stricter definition of backwardation. It may be good enough for government work to say “future is below spot”. But as students of spreads, that is arbitrage, we can do better. There are times when there is an actionable market condition. When the bid on the future is below the ask on spot, one can put on a decarry. That is, sell a gold bar and buy a future. One ends with the same gold as before, but with a profit. In other commodities, if this condition occurs it indicates a shortage. If anyone had wheat or whatever, they would take the trade. The fact that they are not means no one has unencumbered wheat. But in gold, there is no such thing as a shortage (or glut), owing to its high stocks to flows. Backwardation means gold owners are becoming distrustful enough to walk away from a “risk-free” profit (free from conventional risks). Negative GOFO does not necessarily show this, it is a quote made by banks.
A new silver paper crash with rising gold/silver ratio, I know one who is going to be very happy !