
Monetary Metals Supply and Demand Report: 25 May, 2014
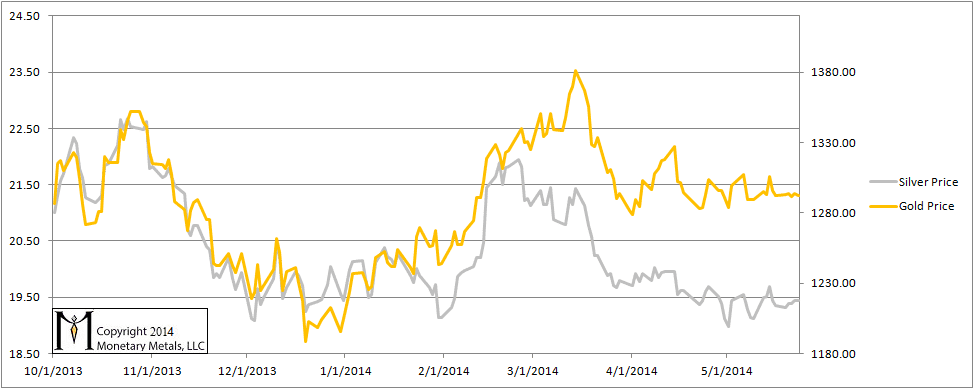
The price of gold was unchanged on the week, and every day in the week too. The silver price ramped 12 cents higher.
As always, we are interested in the fundamentals of supply and demand. Speaking of which, there is something interesting in silver.
Read on…
First, here is the graph of the metals’ prices.
The Prices of Gold and Silver
We are interested in the changing equilibrium created when some market participants are accumulating hoards and others are dishoarding. Of course, what makes it exciting is that speculators can (temporarily) exaggerate or fight against the trend. The speculators are often acting on rumors, technical analysis, or partial data about flows into or out of one corner of the market. That kind of information can’t tell them whether the globe, on net, hoarding or dishoarding.
One could point out that gold does not, on net, go into or out of anything. Yes, that is true. But it can come out of hoards and into carry trades. That is what we study. The gold basis tells us about this dynamic.
Conventional techniques for analyzing supply and demand are inapplicable to gold and silver, because the monetary metals have such high inventories. In normal commodities, inventories divided by annual production can be measured in months. The world just does not keep much inventory in wheat or oil.
With gold and silver, stocks to flows is measured in decades. Every ounce of those massive stockpiles is potential supply. Everyone on the planet is potential demand. At the right price. Looking at incremental changes in mine output or electronic manufacturing is not helpful to predict the future prices of the metals. For an introduction and guide to our concepts and theory, click here.
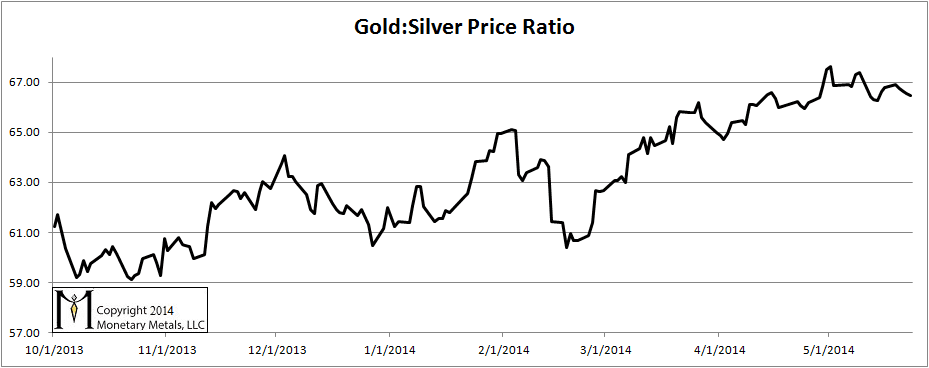
Next, this is a graph of the gold price measured in silver, otherwise known as the gold to silver ratio. The ratio moved down this week, ending below 67.
The Ratio of the Gold Price to the Silver Price
For each metal, we will look at a graph of the basis and cobasis overlaid with the price of the dollar in terms of the respective metal. It will make it easier to provide terse commentary. The dollar will be represented in green, the basis in blue and cobasis in red.
Here is the gold graph.
The Gold Basis and Cobasis and the Dollar Price
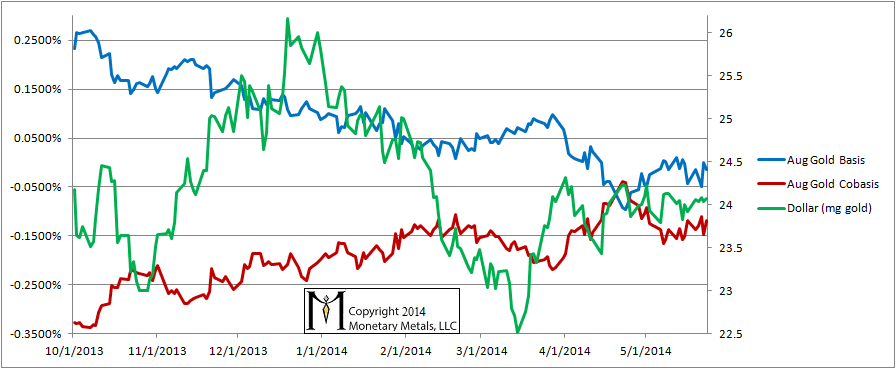
We have switched from watching the June to the August contract, as the contract roll is nearly complete.
The dollar is unchanged and so is the cobasis. This week may as well not have happened, so far as the gold market is concerned.
Now let’s look at silver.
The Silver Basis and Cobasis and the Dollar Price
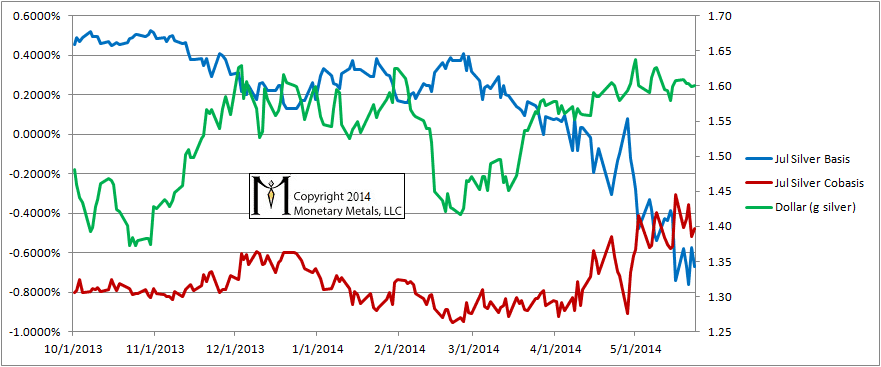
Unlike in gold, the dollar fell slightly in silver terms. Unlike last week, the silver cobasis fell. The silver market un-tightened this week. The trend that might have begun last week did not continue.
© 2014 Monetary Metals

Leave a Reply
Want to join the discussion?Feel free to contribute!