Monetary Metals Supply and Demand Report: 26 Apr, 2015
The price of the dollar rose by 0.55mg gold, and 65mg silver. This is obviously bad for gold speculators, who are betting on a falling dollar. It’s less obvious that it’s bad for borrowers, who are also effectively short the US dollar. It now takes a bit more money (gold) to get out of dollar debts than it did last week.
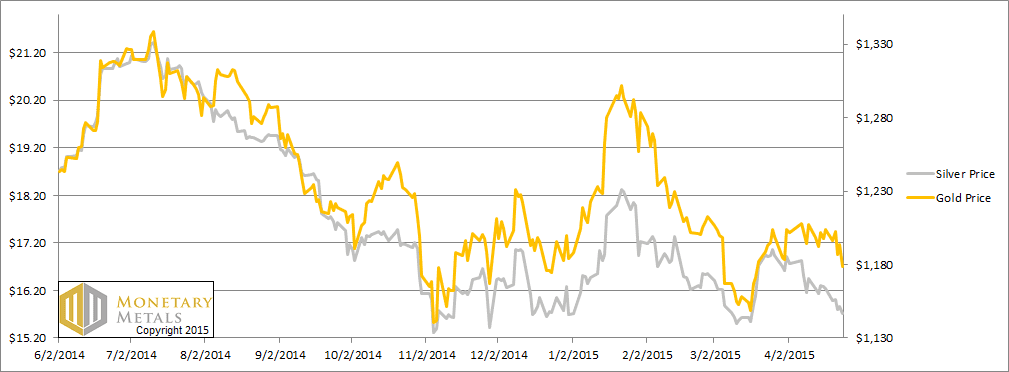
Quoted conventionally, the price of gold fell from $1,204 to $1,179 and the price of silver fell from $16.25 to $15.72.
Last week, we discussed the London gold fix. The process assesses the amount of gold bid and offered, and moves the price a little bit in each round until the amounts balance. It was curious that in each round, the price was lower and the amount of gold offered did not drop. Sellers were price takers, most likely miners and recyclers. Buyers were price sensitive, looking for deals.
Read on to see the only accurate picture of supply and demand in the monetary metals markets…
First, here is the graph of the metals’ prices.
We are interested in the changing equilibrium created when some market participants are accumulating hoards and others are dishoarding. Of course, what makes it exciting is that speculators can (temporarily) exaggerate or fight against the trend. The speculators are often acting on rumors, technical analysis, or partial data about flows into or out of one corner of the market. That kind of information can’t tell them whether the globe, on net, is hoarding or dishoarding.
One could point out that gold does not, on net, go into or out of anything. Yes, that is true. But it can come out of hoards and into carry trades. That is what we study. The gold basis tells us about this dynamic.
Conventional techniques for analyzing supply and demand are inapplicable to gold and silver, because the monetary metals have such high inventories. In normal commodities, inventories divided by annual production (stocks to flows) can be measured in months. The world just does not keep much inventory in wheat or oil.
With gold and silver, stocks to flows is measured in decades. Every ounce of those massive stockpiles is potential supply. Everyone on the planet is potential demand. At the right price, and under the right conditions. Looking at incremental changes in mine output or electronic manufacturing is not helpful to predict the future prices of the metals. For an introduction and guide to our concepts and theory, click here.
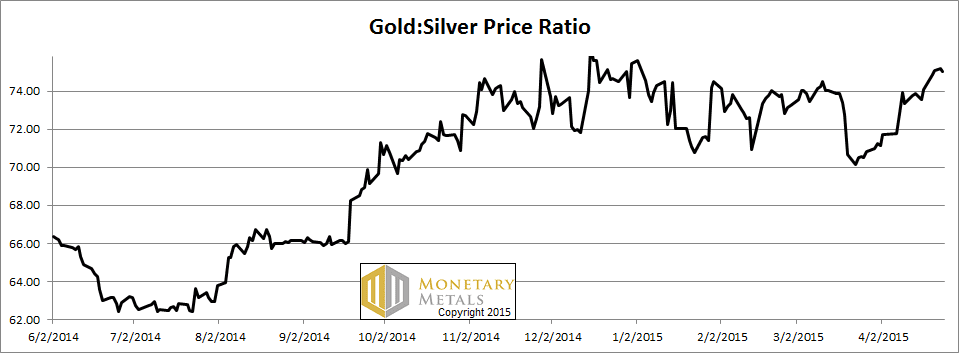
Next, this is a graph of the gold price measured in silver, otherwise known as the gold to silver ratio. It moved up further this week.
The Ratio of the Gold Price to the Silver Price
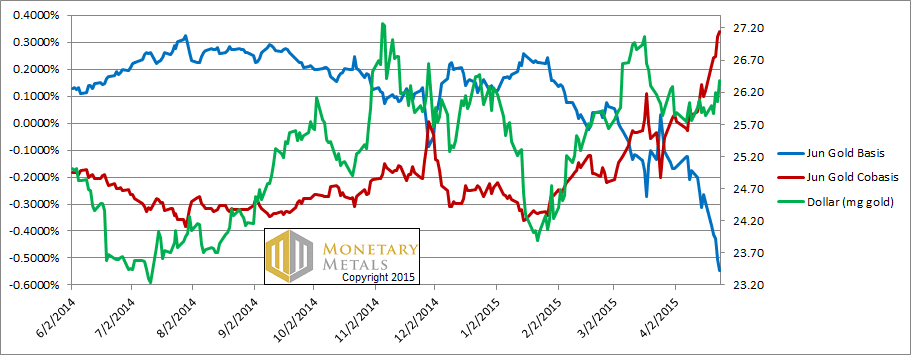
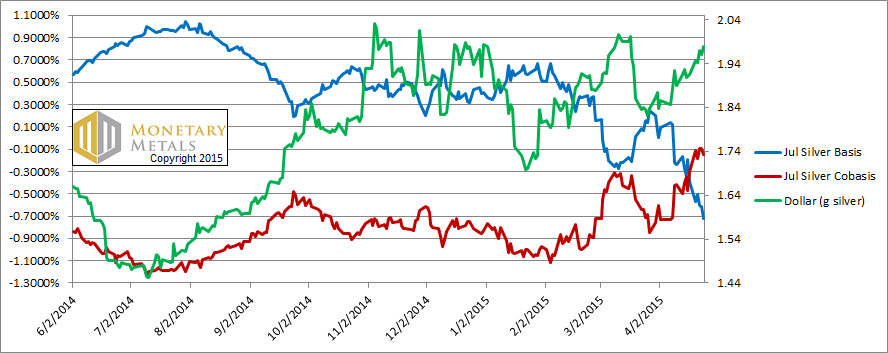
For each metal, we will look at a graph of the basis and cobasis overlaid with the price of the dollar in terms of the respective metal. It will make it easier to provide brief commentary. The dollar will be represented in green, the basis in blue and cobasis in red.
Here is the gold graph.
The Gold Basis and Cobasis and the Dollar Price
Along with the rising dollar (green line), we see rising scarcity in gold (i.e. cobasis, the red line). One could now earn 0.34% annualized, to sell a bar of gold and buy a June contract. Where else can one get that kind of return on a two-month bill or note? This opportunity should never exist in the gold market, but it does.
The August contract is not backwardated yet, but it’s close.
Now let’s look at silver.
The Silver Basis and Cobasis and the Dollar Price
In silver, the cobasis also rose but not as much (and it’s not backwardated). And when you look at farther contracts, the cobasis is much lower. For example, the December silver cobasis is around -0.9%.
Amazing as it sounds, after all this falling price action, silver speculators are still hanging on and still holding up the price quite a bit.
Whereas in gold the fundamental price is about $70 over the market price, in silver it’s about 90 cents below. We wonder what it will take to make them capitulate, and what the price chart will look like when that happens. Who knows, perhaps the supply and demand fundamentals will change before then?
© 2015 Monetary Metals


Re silver and capitulation: 4 years down from the top of its historical trading range and the Comex open interest is within an ace of the all-time high that occurred prior to the 2008 collapse. Ain’t that amazin’ ? How’s about single digits price for a capitulation?
The crash will be in bonds and stocks sure gold and silver can fall futher but they have already priced in the coming carnage unlike stocks and bonds and won’t go to zero like paper assets. Out of the dust of CBs fiats stocks and bonds the metals will show why thay have stood the test of time. The negativety around Gold and silver is a pointer to limited downside.
Thanks for your comments.
Jim: open interest is a function of the basis spread. And the basis spread is a function of … speculators who buy futures. I would not bet on single-digit silver prices (though I wouldn’t be terribly surprised if it happens).
Ross: It’s a paradigm shift to think of the value of the dollar in gold, rather than the conventional view of gold valued in dollars.
Keith, thanks again for your work. I agree that pricing gold with a USD measuring tape that keeps moving makes no sense. I find your basis charts great for the short term moves but when analysing in the long term is there a better way to price gold?
Some people try to price it to real things like a commodity index. This makes sense to me but not all commodity indexes are the same. Do you do so yourself and how?
Also, do you have longer term charts for the basis and cobasis? I would like to see the market extremes and going one year back doesn’t seem far enough.