
Monetary Metals Supply and Demand Report: 27 Oct, 2013
On Tuesday, US payroll data showed a smaller rise than expected. The prices of the monetary metals shot up on the news. On Friday, CNBC ran a story that reiterated that Quantitative Easing will continue. It was enough to arrest and partially reverse dropping prices. As always, we want to know: what are the fundamentals?
We are interested in the changing equilibrium created when some market participants are accumulating hoards and others are dishoarding. Of course, what makes it exciting is that speculators can (temporarily) exaggerate or fight against the trend. The speculators are often acting on rumors, technical analysis, or partial data about flows into or out of one corner of the market. That kind of information can’t tell them whether the globe, on net, hoarding or dishoarding.
One could point out that gold does not, on net, go into or out of anything. Yes, that is true. But it can come out of hoards and into carry trades. That is what we study. The gold basis tells us about this dynamic.
Conventional techniques for analyzing supply and demand are inapplicable to gold and silver, because the monetary metals have such high inventories. In normal commodities, inventories divided by annual production can be measured in months. The world just does not keep much inventory in wheat or oil.
With gold and silver, stocks to flows is measured in decades. Every ounce of those massive stockpiles is potential supply. Everyone on the planet is potential demand. At the right price. Looking at incremental changes in mine output or electronic manufacturing is not helpful to predict the future prices of the metals. For an introduction and guide to our concepts and theory, click here.
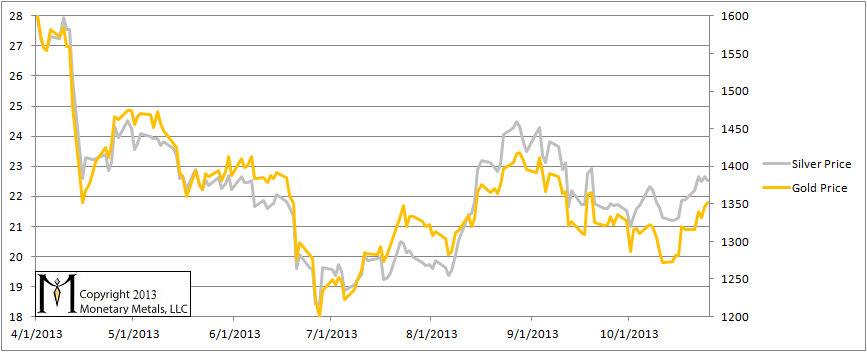
Here is the graph of the metals’ prices.
The Prices of Gold and Silver
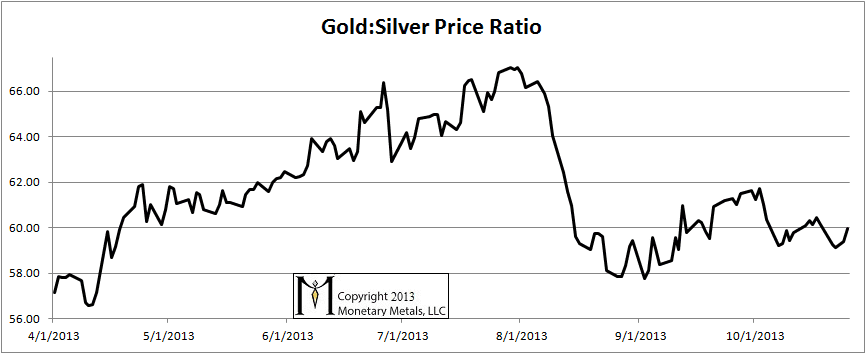
Here is a graph of the ratio of the gold price to the silver price. This shows how many ounces of silver one needs, to buy an ounce of gold. There was not much change this week.
The Ratio of the Gold Price to the Silver Price
For each metal, we will look at a graph of the basis and cobasis overlaid with the price of the dollar in terms of the respective metal. It will make it easier to provide terse commentary. The dollar will be represented in green, the basis in blue and cobasis in red.
Here is the gold graph.
The Gold Basis and Cobasis and the Dollar Price
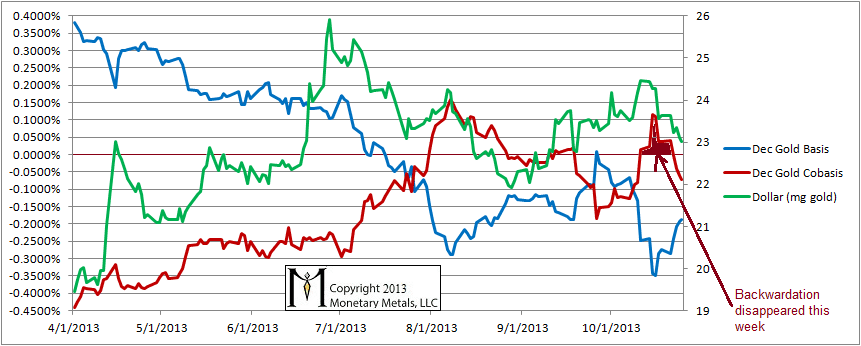
The news people don’t seem to get tired of the “no taper” story, and neither do the gold speculators (at least not yet). Two things should be obvious on this graph. First, gold is no longer backwardated.
Second, for a few weeks now the price of the dollar has been falling and along with it so has the strength of gold fundamentals. A wee move from 24.5mg for the dollar to 23mg has brought more gold to market. While the price might rise—who knows, they might even announce “NO TAPERING, NO REALLY!” this week—this is probably not the gold price breakout you’re looking for. Put on your best Obi Wan Kenobe voice, it may help.
Now let’s look at silver.
The Silver Basis and Cobasis and the Dollar Price
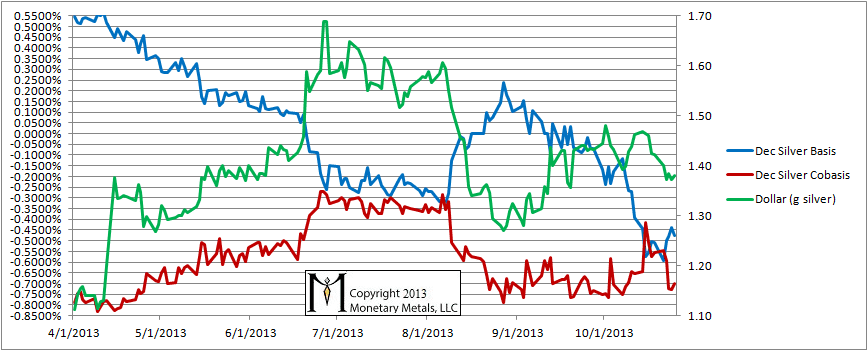
Silver is in a similar trend, though the cobasis is at a much lower level. By contrast, the silver cobasis is about 10X lower.
Good Morning Keith,
Once gold begins to emerge from backwardation, do we expect to see rises in the gold price until expiration of the futures contract?
so where is supply demand report?
I thought the definition of backwardation is that the basis is negative – this seems to be the case for both gold and silver, no?
First I see this “….First, gold is no longer backwardated….”
Which is followed in the last paragraph by this: “…In case you missed it above, December gold is slightly backwardated….”
I’m confused.
Lastly there’s this sentence: “…For an introduction and guide to our concepts and theory, click here….”
Click where? There’s no active link that I can find.
Thanks for the comments.
bleubelle: When a monetary metal goes from backwardated, to not-backwardated, that is a weakening of the supply and demand fundamentals. It is not a bullish sign.
knop: above :)
petter: we use a positive cobasis as a stricter definition of backwardation.
Long: Good catches. I should have edited out the reference to slight backwardation, from last week’s report. The link should be here (https://monetary-metals.com/introduction-to-the-monetary-metals-supply-and-demand-report/).
Thank You Keith for your response- I had assumed a weakening of the supply (moving out of backwardation) would in turn cause the price of the metal to surge higher.
Thanks for the link – appreciate the time you put into responding to our questions.
:)