Monetary Metals Supply and Demand Report: 29 Sep, 2013
The “No Taper” announcement has been long forgotten, another flash in the pan like most Fed announcements and non-announcements before it. Leveraged speculators jump in, based on the Quantity Theory of Money. If the announcement seems to imply more money “printing” (it’s really borrowing), then prices “should” go up. And the speculators aggressively meet their own expectations, at least for a moment.
Meanwhile, back in reality some people are accumulating hoards and others are dishoarding. These people have their reasons, which have nothing to do with what you see on TV or read in the financial press (or alternative financial blogs, for that matter).
The speculators are really trying to front-run the hoarders and dis-hoarders. This is why the latter always win in the end. Right now, for a variety of reasons, the dis-hoarders are more aggressive. We see this in the falling cobasis for both metals.
Conventional techniques for analyzing supply and demand are inapplicable to gold and silver, because the monetary metals have such high inventories. In normal commodities, inventories divided by annual production can be measured in months. The world just does not keep much inventory in wheat or oil.
With gold and silver, stocks to flows is measured in decades. Every ounce of those massive stockpiles is potential supply. Everyone on the planet is potential demand. At the right price. Looking at incremental changes in mine output or electronic manufacturing is not helpful to predict the future prices of the metals. For an introduction and guide to our concepts and theory, click here.
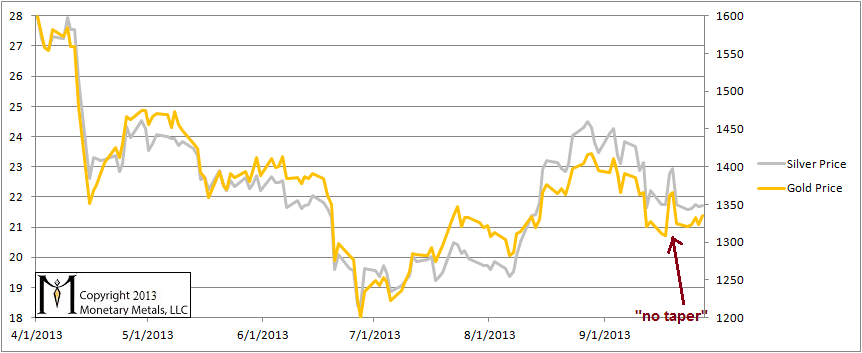
The price action this week was flat to slightly rising. Here is a graph. The “no taper” blip is already lost in the noise. One would not see the great anticipation and reaction to the announcement by looking at this picture.
The Prices of Gold and Silver
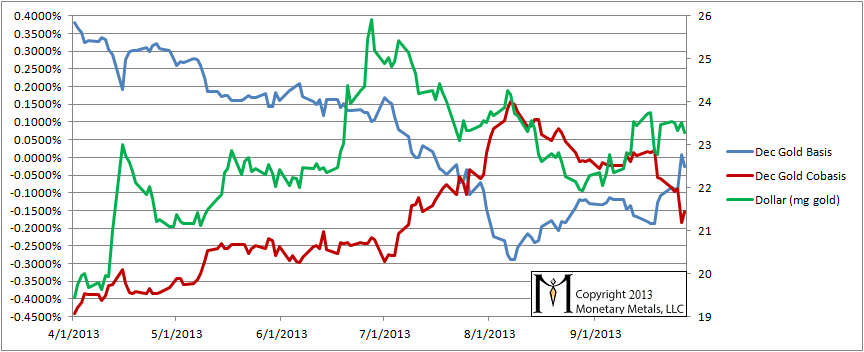
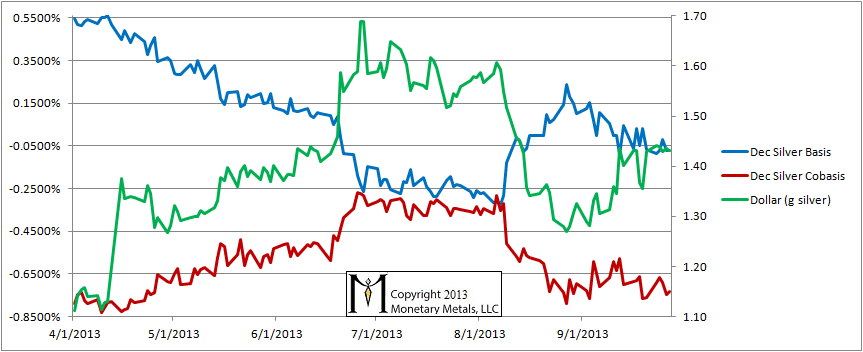
For each metal, we will look at a graph of the basis and cobasis overlaid with the price of the dollar in terms of the respective metal. It will make it easier to provide terse commentary. The dollar will be represented in green, the basis in blue and cobasis in red.
Here is the gold graph. We have switched from October to December, as the open interest in October has collapsed and now the October contract is heading rapidly towards expiration.
The Gold Basis and Cobasis and the Dollar Price
The dollar fell slightly (the inverse of the statement above that the price of gold was flat to rising). What is interesting is the ongoing drop in the cobasis. For the first time since July, the December gold contract was in contango on Thursday (it slipped on Friday).
If speculators were driving the moves, then we should expect to see the cobasis tracking with the dollar price. As the dollar price moves higher (i.e. gold is selling off and its price in dollars is moving lower), we should see more scarcity and a rising cobasis. And the opposite is true, as speculators are buying gold futures, the price of the dollar is falling and the cobasis is falling, which reflects rising abundance at the higher prices.
But that isn’t what we see since the end of August. We see a rising dollar price (i.e. falling gold price) and a falling cobasis. This is a bullish sign for the dollar price. There is no backwardation in any gold contracts as of Friday.
We reiterate that we NEVER RECOMMEND NAKED SHORTING OF THE MONETARY METALS.
Now let’s look at silver.
The Silver Basis and Cobasis and the Dollar Price
The cobasis in silver, as with gold, shows no signs of rising scarcity as the dollar price rises. There is no backwardation with any silver contracts.
The Ratio of the Gold Price to the Silver Price
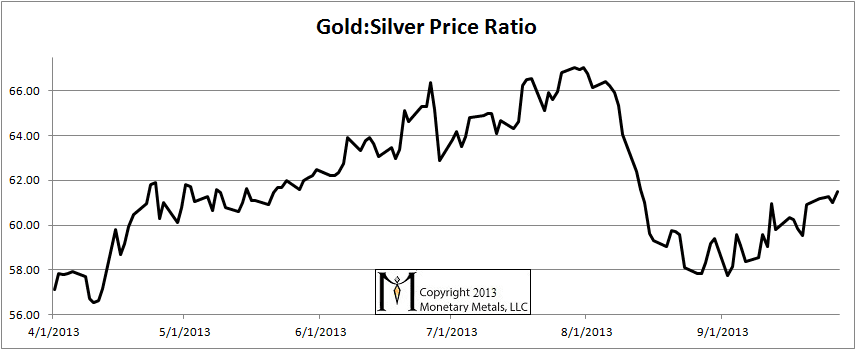
The ratio of the gold price divided by the silver price moved up a bit this past week.


Thank you. I appreciate all of your reports and never miss reading any of them.
me too
>> The “No Taper” announcement has been long forgotten, another flash in the pan like most Fed announcements and non-announcements before it.
Lol, amen.
Thank you Keith. Always looking forward to your writings and analysis.
Is this bullish for gold?
This tells me that there is still confidence in paper gold (the promise by someone else to return my lent gold at some point in the future) and that counter party risk is perceived to be low. By extension, confidence in fiat currency (USD) is still high and rising at the moment. Is this a fair interpretation of your analysis or do I have this all wrong?