Monetary Metals Supply and Demand Report: 30 Mar, 2014
The gold price fell about forty bucks, and the silver price fell about fifty cents. There are many ongoing rumors about what could be happening in supply and demand for the metals. Mostly, these are about how the world is gobbling up physical metal and the prices will soon skyrocket. A well-known commentator this week declared that manipulation is so “obvious” now that it ought to embarrass the manipulators. We’re not big on trying to embarrass anyone, but we would suggest that anyone who wants to know the truth about the persistent manipulation conspiracy theory should read on below, in the discussion on gold.
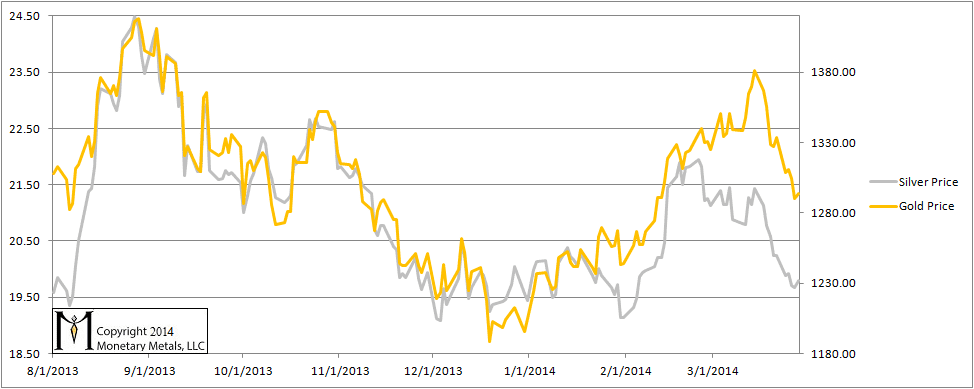
Here is the graph of the metals’ prices.
The Prices of Gold and Silver
We are interested in the changing equilibrium created when some market participants are accumulating hoards and others are dishoarding. Of course, what makes it exciting is that speculators can (temporarily) exaggerate or fight against the trend. The speculators are often acting on rumors, technical analysis, or partial data about flows into or out of one corner of the market. That kind of information can’t tell them whether the globe, on net, hoarding or dishoarding.
One could point out that gold does not, on net, go into or out of anything. Yes, that is true. But it can come out of hoards and into carry trades. That is what we study. The gold basis tells us about this dynamic.
Conventional techniques for analyzing supply and demand are inapplicable to gold and silver, because the monetary metals have such high inventories. In normal commodities, inventories divided by annual production can be measured in months. The world just does not keep much inventory in wheat or oil.
With gold and silver, stocks to flows is measured in decades. Every ounce of those massive stockpiles is potential supply. Everyone on the planet is potential demand. At the right price. Looking at incremental changes in mine output or electronic manufacturing is not helpful to predict the future prices of the metals. For an introduction and guide to our concepts and theory, click here.
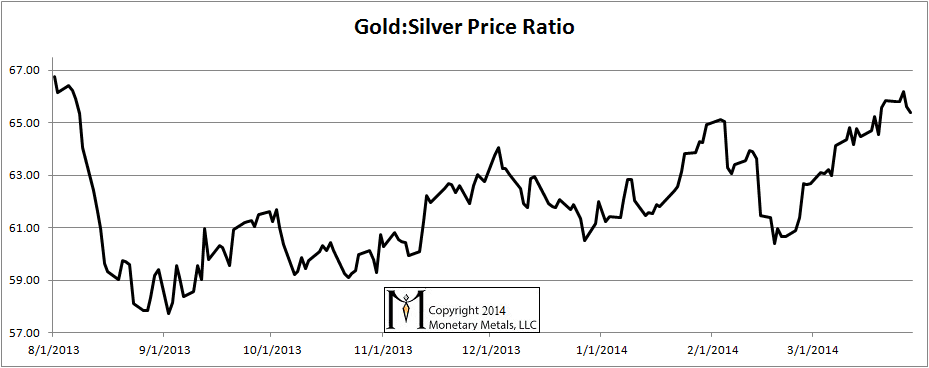
Here is a graph of the gold price measured in silver, otherwise known as the gold to silver ratio.
The Ratio of the Gold Price to the Silver Price
For each metal, we will look at a graph of the basis and cobasis overlaid with the price of the dollar in terms of the respective metal. It will make it easier to provide terse commentary. The dollar will be represented in green, the basis in blue and cobasis in red.
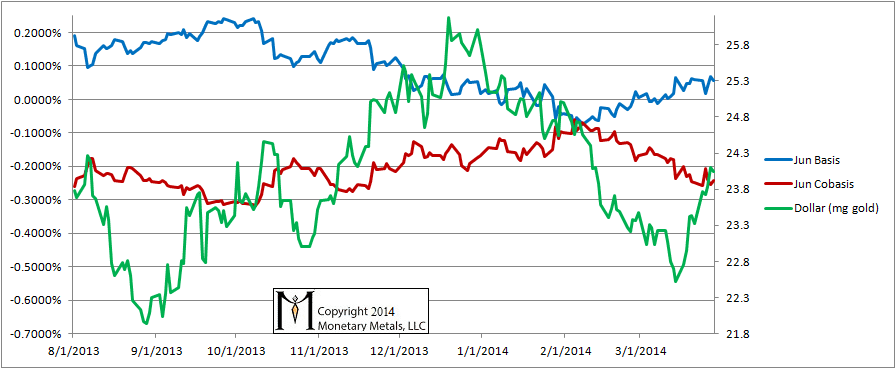
Here is the gold graph. We have switched over from the April to June contract, as April is now past First Notice Day, and is therefore illiquid.
The Gold Basis and Cobasis and the Dollar Price
The green line represents the price of the dollar, measured in gold. Unorthodox, we know. But it paints a far clearer picture of what’s happening than one can get from plotting the price of gold measured in terms of the (failing) dollar. It shows the dollar has been rising these past two weeks, which is what everyone knows—the price of gold has dropped almost a hundred dollars in two weeks.
Anyways, the very basis of this report (no pun intended) is to look at the fundamentals of the monetary metals markets. “Fundamentals” here doesn’t mean mine production and jewelry consumption. It means tracking the difference between speculators bidding up futures vs. hoarders taking real metal out of the market, presumably never to return.
By plotting the dollar on top of the cobasis, we can see speculative vs. fundamental moves. In a speculative move, the two lines move together. That is, as gold is sold (i.e. the dollar gets stronger) the cobasis rises (i.e. gold becomes more scarce). As gold gets bought (weaker dollar) the cobasis falls (less scarce gold).
If the lines move in opposite directions, it’s not a speculative move but fundamental. Dear reader, if you’re using leverage to bet on a rising gold price, the graph shows bad news. For two weeks in a row we see sharply rising dollar (i.e. falling gold price) and falling cobasis (more plentiful gold).
This isn’t the gold shortage you’re looking for.
Now, as to manipulation… what is supposed to be happening? The manipulators are selling futures like mad, right? What would that do? It would push the price on the futures down, well, presumably by $100, as that is how much the gold price has dropped in two weeks. Forgetting even the persistent rumors that China is buying up physical metal, and there should be a wicked backwardation! If the June future price were $100 below spot, that would give us a cobasis of +31%. Instead, the reality is -0.24%.
The data does not fit the allegation.
Now let’s look at silver.
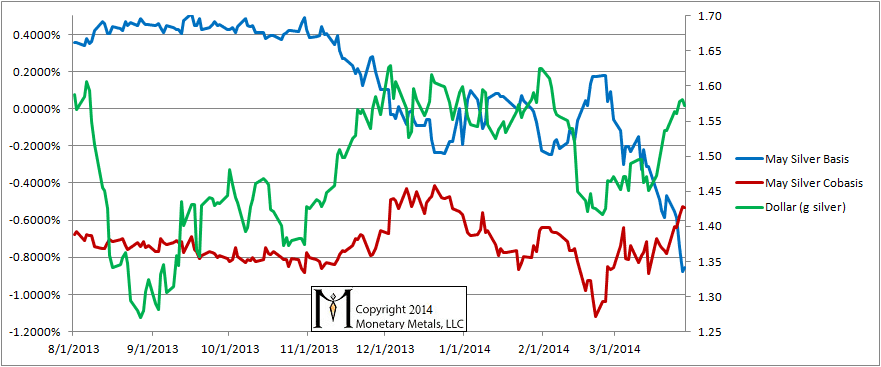
The Silver Basis and Cobasis and the Dollar Price
The dollar got stronger when measured in silver as well. The cobasis has risen again, though it’s still at a far lower level than that in gold. And The May silver contract is now within the period of selling called the contract roll. Not too long ago, we saw backwardation even farther ahead of First Notice Day than we are now in this contract.
© 2014 Monetary Metals


Another bad week for gold and a bad one for the dollar, so I was sure that Keith would be happy !
Most commentators are now bearish for gold based on TA but you will still find some some who are still on the moto “to da moon” but there are a very small minority and fortunately there are here, otherwise there would be nobody anymore to be scoffed !
Lastly, the above numbers show clearly that speculators are not frontrunning physical buyers/hoarders who used the COMEX (and LBMA ?) to purchase their gold but we still do not know if and what transactions are made off market without using these exchnages (or the Shangai gold exchange).
Lastly, it seems more and more probable that the dollar devaluation against gold will now come in a sudden non linear event compared with what happened from 2001 to 2011.
Excellent report Keith
pherisse: If you know my writing, you know that I don’t think gold has a good or bad anything. Gold isn’t going anywhere, it’s the dollar that goes mostly down but can go up due to credit tightening.
I agree with your last point, that what’s coming to the dollar is likely to be highly non-linear. Though this does not preclude a linear drop in the intermediate term, from 24mg to 12, and from 12 to 6 before the final catastrophic plunge to 0.
bleubelle: thank you. :)
Keith, I appreciate your analysis. I used to listen to the gold bulls, and for whatever reason ZeroHedge published your analyses–which oddly enough seemed quite dispassionately different than what the GB were arguing. I give ZH credit for presenting multiple sides.
So I watched–and discovered that what you were/are saying fits market action better than others. A couple weeks ago I was considering a purchase of PMs but before I read your report, and I held off. There just doesn’t seem to be any pending technical reason why PMs are going to start zooming up.
I’m educated as a quantitative scientist so when I see someone else doing that kind of thing, it makes me feel all warm inside. Data doesn’t lie. :)
Since the political reality (Bund having to wait years to get what seems a piddling amount of gold repatriated, China hoovering gold like Scrooge McDuck, etc.) conflicts with the market reality (what Keith has been reporting and analyzing), it seems a “linear event” (AKA “phase transition”) is inevitable.
But one thing I have learned is to never be too sure about anything.
Keith,
Can you clear this paragraph up for me? I don’t know if the way you are saying it is throwing me or what…
“By plotting the dollar on top of the cobasis, we can see speculative vs. fundamental moves. In a speculative move, the two lines move together. That is, as gold is sold (i.e. the dollar gets stronger) the cobasis rises (i.e. gold becomes more scarce). As gold gets bought (weaker dollar) the cobasis falls (less scarce gold).”
If gold is being brought to market (what i take to be “sold” here, which i guess it depends on which institution is doing the selling to make this work…) then should’nt the cobasis be pushed down? And when gold is bought (what i take to mean hoarders hoarding metal) then wouldn’t that make gold more scarce and push the cobasis up? Any help here?
When gold is brought to market, it becomes less “scarce” and trends toward contango.
When it is sold away from the bullion markets and into hoards, it becomes more scarce and trends toward backwardation.
Wally: I was referring to a speculative move, which refers to changes in speculative, i.e. futures, positions. I should have said if gold futures get sold…
“By plotting the dollar on top of the cobasis, we can see speculative vs. fundamental moves. In a speculative move, the two lines move together. That is, as gold is sold (i.e. the dollar gets stronger) the cobasis rises (i.e. gold becomes more scarce). As gold gets bought (weaker dollar) the cobasis falls (less scarce gold).
If the lines move in opposite directions, it’s not a speculative move but fundamental.”
KEITH! My man! You summed it all up so beautifully there! This could be the seed of the whole idea for your site, the one thing you can say that conveys the deep value in your approach.
Just regarding this week’s price action, I subscribe to the theory that Ukrainian physical is just being rehypothecated out the wazhoo,but that it is newly present in the bullion bank vaults and has thus satiated the temporary backwardation for now. So… manipulation, but of the non-market sort that involves actual new liquid metal (possibly even freshly melted). I have no evidence of this, just my crazy imagination.
Thanks Greg,
I’ve been biting my tongue on the Ukrainian gold rumors. Could it be that Ukraine, what with facing the possibility of a Russian invasion, want to move their gold to a safe place in the meantime? They may be a bit more worried about a looting army more than about rumors that circulate in the gold bug community…
Hi Keith,
I’m always interested in what you have to say, especially when it confronts some of the popular (mis)perceptions of the market. So on that note and seeing as you’re interested in using data to discern the truth of situations, what do you make of this chart?
http://goldchartsrus.com/chartstemp/IntradayGCManipulation.php
Six years of intraday gold price data from 2006-2012 clearly showing (on average) a fall from the London open all the way to the PM fix from where it recovers overnight?
Coincidence, bad data, attributable to other factors, naive analysis?
I await you reply with interest.
MetalsD
Metals: I don’t know what to make of it. It raises more questions than it provides answers. First, what price is that a graph of? Spot gold? COMEX futures? Second, are they using the bid price, ask price, or last cleared price?
A few tens of cents on a $1000 gold price is small. The bid-ask spread and the spot-futures spread widen by that much or more at times of low liquidity (e.g. overnight).
I have a major ongoing theme in my writing. Most Westerners think of gold in terms of its dollar price. They trade it to make more dollars, which they regard as money. They want to buy gold while it’s “going up” and sell gold hopefully before it “goes down”. In a broad sense, *THIS* is the manipulation.
Entire generations of people have been trained to think of the government’s paper scrip as money, and gold as a volatile commodity.
If this wasn’t so, then how would anyone explain why gold continues to come to market even after the price drops? Or comes to market *because* the price drops? Most people have no idea how to value gold, the singular best money ever discovered. Their faith in the failing government bond is strong.
“Yes, Yes!” says the gold speculator. “Those people should know to stop selling, and let the price go up–so I can sell my gold and make a profit!”
So long as market participants view gold only in terms of how many dollars it can buy, then the price will move all over the place. It’s like the planchette on a Ouija board.
Hi. I am not really sure about all this,but I grant it is good analysis.
As a speculator or potential hoarder/dishoarder I can buy or sell futures contracts and get out either way by closing the trade and settle in Cash.
However in effect I am taking out a contract to either deliver gold or take delivery.
So if I am a deliverer of gold in effect a dishoarder, i am buying $$$ and punting that they will go up in value, and visa versa if I take delivery.
Could it not be true that the $USD is being or at least be trying to be stopped (manipulated) from falling relative to gold ?
After all the size of the currency markets dwarfs the gold market, and the USA has a lot lose if the $USD is devalued which makes me wonder why they are printing so much.
Anyway, I am a small hoarder because I believe it is wealth. What I buy has ZERO effect on the price.
BIG BIG players know golds true value and in $$$$ terms that is much higher than quoted on a tote board.
SW
Sway, I agree those who sell gold are betting the dollar will rise.