
Monetary Metals Supply and Demand Report: 31 Aug, 2014
The prices of the metals barely moved this week.
Readers have been asking if there has been any signs of a turn in the market, especially for silver. Something may be happening. Read on…
First, here is the graph of the metals’ prices.
The Prices of Gold and Silver
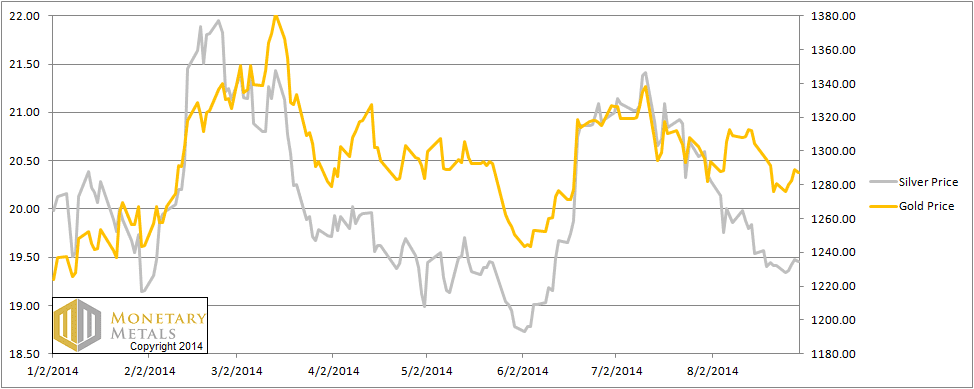
We are interested in the changing equilibrium created when some market participants are accumulating hoards and others are dishoarding. Of course, what makes it exciting is that speculators can (temporarily) exaggerate or fight against the trend. The speculators are often acting on rumors, technical analysis, or partial data about flows into or out of one corner of the market. That kind of information can’t tell them whether the globe, on net, hoarding or dishoarding.
One could point out that gold does not, on net, go into or out of anything. Yes, that is true. But it can come out of hoards and into carry trades. That is what we study. The gold basis tells us about this dynamic.
Conventional techniques for analyzing supply and demand are inapplicable to gold and silver, because the monetary metals have such high inventories. In normal commodities, inventories divided by annual production can be measured in months. The world just does not keep much inventory in wheat or oil.
With gold and silver, stocks to flows is measured in decades. Every ounce of those massive stockpiles is potential supply. Everyone on the planet is potential demand. At the right price. Looking at incremental changes in mine output or electronic manufacturing is not helpful to predict the future prices of the metals. For an introduction and guide to our concepts and theory, click here.
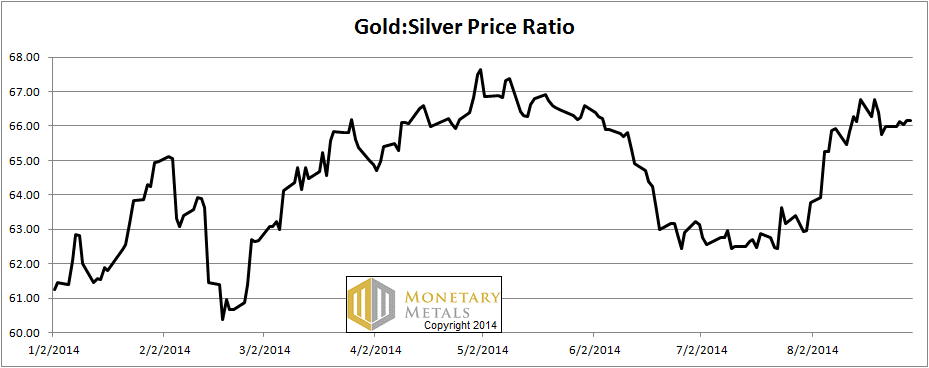
Next, this is a graph of the gold price measured in silver, otherwise known as the gold to silver ratio. The ratio moved up a hair.
The Ratio of the Gold Price to the Silver Price
For each metal, we will look at a graph of the basis and cobasis overlaid with the price of the dollar in terms of the respective metal. It will make it easier to provide terse commentary. The dollar will be represented in green, the basis in blue and cobasis in red.
Here is the gold graph.
The Gold Basis and Cobasis and the Dollar Price
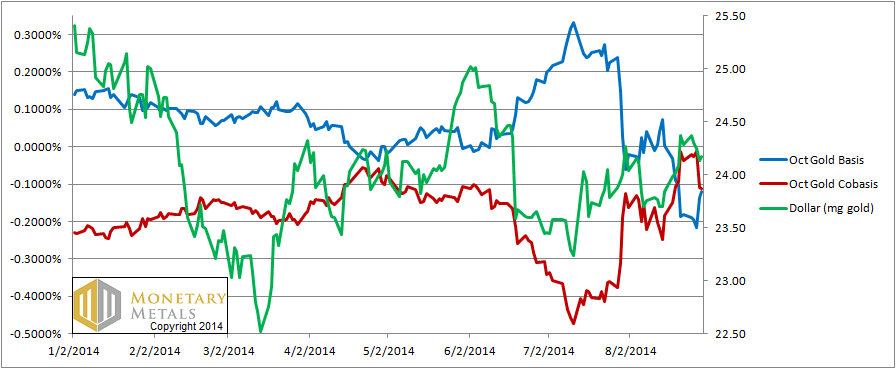
The cobasis (i.e. scarcity) and the dollar price (i.e. inverse of the gold price measured in dollars) continued their correlation. The dollar price fell a little, and the cobasis fell a little. Neither move was terribly interesting.
Price moves continue to be driven by speculators repositioning themselves. As speculators buy, the gold price goes up (i.e. dollar price goes down). The scarcity of gold is going down right along with.
Now let’s look at silver.
The Silver Basis and Cobasis and the Dollar Price
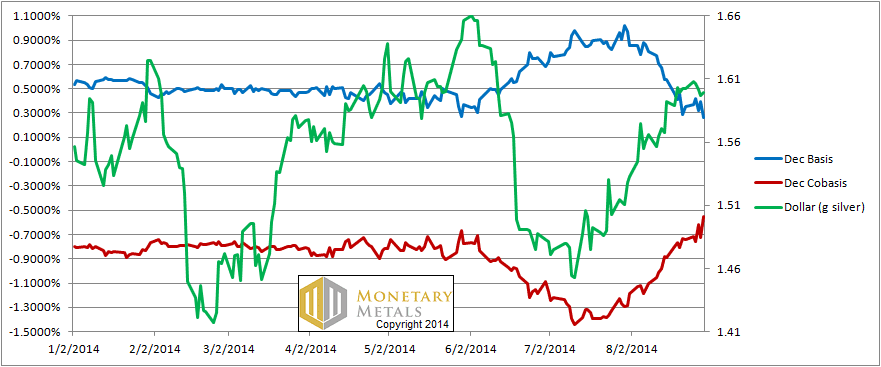
The cobasis (i.e. scarcity) in silver is ticking its way upwards, and not due to a rising dollar price (i.e. falling silver price). The dollar price did not change this week, but the silver cobasis rose from -0.74% to -0.55%.
Is this the start of a new trend, of renewed scarcity in this metal? The data is beginning to move in that direction, but we would be cautious about placing capital in harm’s way just yet. It could be the leading edge of a trend change, or it could be a temporary little blip. It bears watching.
Stay tuned next week. Same bat time, same bat channel!
© 2014 Monetary Metals
OK Batman
Thank you and have a nice Labor day.
Thank You as always Keith.
I have dumb question.
Is it a bad idea to buy, Gold and Silver regularly as a form of savings, and not worry about the fluctuations in price?
I use my cash that I don’t see needing, for 10 years or more.
I just look at the fact money keeps buying less and less, and earns basically no interest.
How do You suggest I do it?
Hope to hear Your thoughts.
Thank You
muledeerman, I hope its a good idea, thats what I do.. haha
Me too Max,
the author here doesn’t reply to my questions.
Maybe Im not important enough, I don’t know.
Happy September 2
Thanks Keith !