
Monetary Metals Supply and Demand Report: 4 May, 2014
This week again, the prices of the metals were sagging. Until the unemployment data hit. Then the prices began to rise. On the week, the gold price was down $4 and the silver price was down 25 cents.
Was it hoarders all round the world, this time, watching the news? Were they sitting in their cars all around the world waiting for the right exact moment to time “the bottom” and begin stocking up on physical metals to trade the improving economy and price inflation sure to come with it?
Maybe. Read on…
First, here is the graph of the metals’ prices.
The Prices of Gold and Silver

We are interested in the changing equilibrium created when some market participants are accumulating hoards and others are dishoarding. Of course, what makes it exciting is that speculators can (temporarily) exaggerate or fight against the trend. The speculators are often acting on rumors, technical analysis, or partial data about flows into or out of one corner of the market. That kind of information can’t tell them whether the globe, on net, hoarding or dishoarding.
One could point out that gold does not, on net, go into or out of anything. Yes, that is true. But it can come out of hoards and into carry trades. That is what we study. The gold basis tells us about this dynamic.
Conventional techniques for analyzing supply and demand are inapplicable to gold and silver, because the monetary metals have such high inventories. In normal commodities, inventories divided by annual production can be measured in months. The world just does not keep much inventory in wheat or oil.
With gold and silver, stocks to flows is measured in decades. Every ounce of those massive stockpiles is potential supply. Everyone on the planet is potential demand. At the right price. Looking at incremental changes in mine output or electronic manufacturing is not helpful to predict the future prices of the metals. For an introduction and guide to our concepts and theory, click here.
Next, this is a graph of the gold price measured in silver, otherwise known as the gold to silver ratio. The ratio moved up this week, going over 67, but ending below the line as the silver price rallied sharply on Friday.
The Ratio of the Gold Price to the Silver Price

For each metal, we will look at a graph of the basis and cobasis overlaid with the price of the dollar in terms of the respective metal. It will make it easier to provide terse commentary. The dollar will be represented in green, the basis in blue and cobasis in red.
Here is the gold graph.
The Gold Basis and Cobasis and the Dollar Price
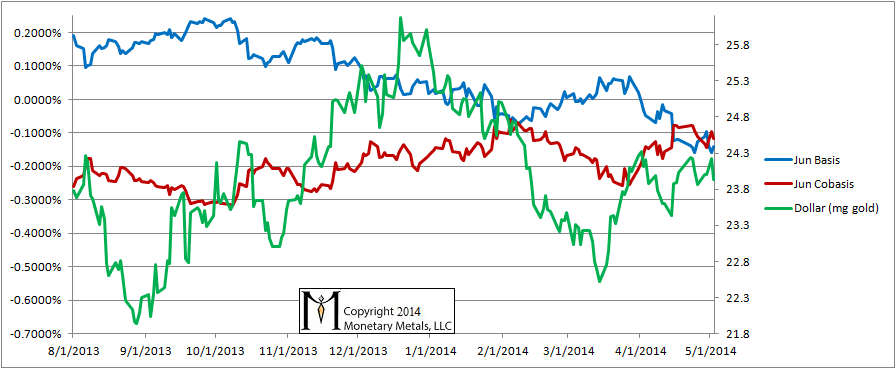
The dollar didn’t change much. The cobasis dropped, but that does not reflect the most of the price spike, which began a bit later in the day. We will have to wait until this week to see the impact, but preliminary data suggests the cobasis dropped a bit.
Now let’s look at silver.
The Silver Basis and Cobasis and the Dollar Price
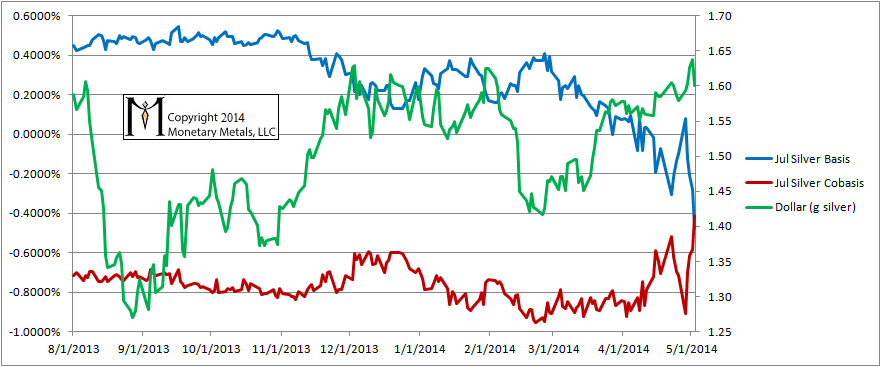
The cobasis rose relentlessly this week, though preliminary data suggests it dropped substantially in the buying frenzy that spiked the silver price.
© 2014 Monetary Metals
Dear Keith,
In other words, the rising cobasis in solver indicated good fundamental demand by “hoarders” near the lows of last week. Buying the dip but not chasing the rally.
John: You are correct. As the price fell, there was either less selling of futures or more buying of metal.
Today (Monday) is a bank holiday in the UK. With the reduced liquidity, we won’t count the basis data from today as part of our permanent basis record.
That said, the silver basis is considerably higher than it was on Friday, and the cobasis is down.