
Monetary Metals Supply and Demand Report: 5 Apr, 2015
In the shortened week (Good Friday), the prices of the metals didn’t change much, though it’s notable that the price of gold went up a few bucks while the price of silver dropped a few dimes. We discussed that a few weeks ago.
For a picture of the changing supply and demand fundamentals of gold and silver, read on…
First, here is the graph of the metals’ prices.
The Prices of Gold and Silver
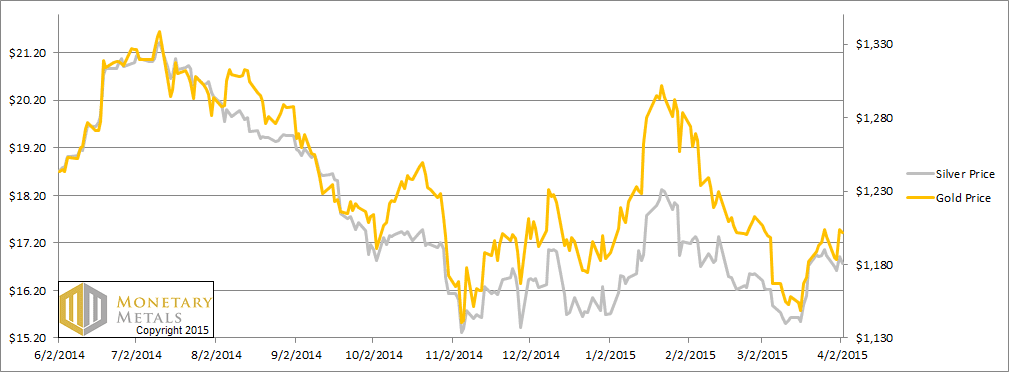
We are interested in the changing equilibrium created when some market participants are accumulating hoards and others are dishoarding. Of course, what makes it exciting is that speculators can (temporarily) exaggerate or fight against the trend. The speculators are often acting on rumors, technical analysis, or partial data about flows into or out of one corner of the market. That kind of information can’t tell them whether the globe, on net, is hoarding or dishoarding.
One could point out that gold does not, on net, go into or out of anything. Yes, that is true. But it can come out of hoards and into carry trades. That is what we study. The gold basis tells us about this dynamic.
Conventional techniques for analyzing supply and demand are inapplicable to gold and silver, because the monetary metals have such high inventories. In normal commodities, inventories divided by annual production (stocks to flows) can be measured in months. The world just does not keep much inventory in wheat or oil.
With gold and silver, stocks to flows is measured in decades. Every ounce of those massive stockpiles is potential supply. Everyone on the planet is potential demand. At the right price, and under the right conditions. Looking at incremental changes in mine output or electronic manufacturing is not helpful to predict the future prices of the metals. For an introduction and guide to our concepts and theory, click here.
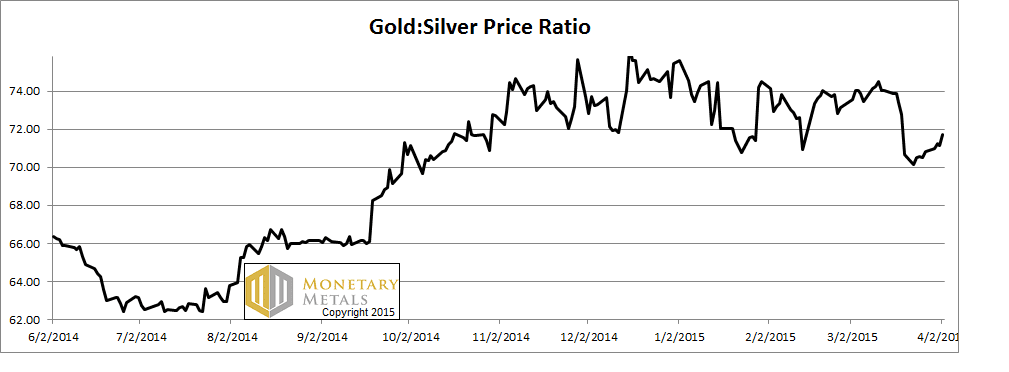
Next, this is a graph of the gold price measured in silver, otherwise known as the gold to silver ratio. It moved up further this week.
The Ratio of the Gold Price to the Silver Price
For each metal, we will look at a graph of the basis and cobasis overlaid with the price of the dollar in terms of the respective metal. It will make it easier to provide brief commentary. The dollar will be represented in green, the basis in blue and cobasis in red.
Here is the gold graph.
The Gold Basis and Cobasis and the Dollar Price
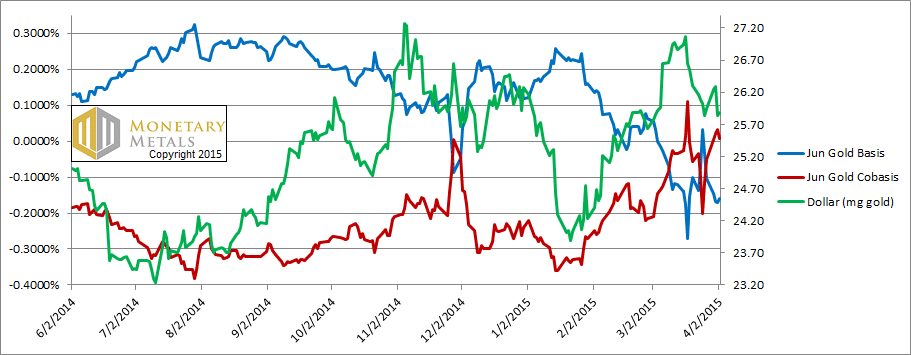
The dollar fell (i.e. price of gold rose) and at the same time, the cobasis (i.e. scarcity) rose as well. It wasn’t just the June contract, but farther months as well. The moves, however, were small. Those hoping for significant and durable increases in the price of gold should look to see this happen in a bigger way.
Our calculated fundamental price of gold went up about twenty bucks this week, remaining well above the market price.
Now let’s look at silver.
The Silver Basis and Cobasis and the Dollar Price
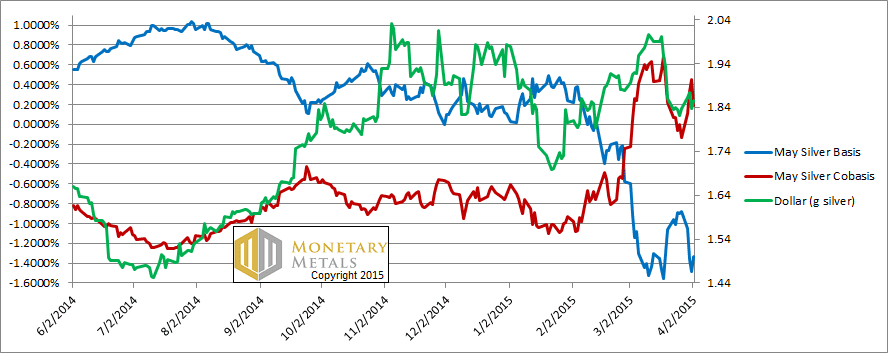
In silver, the cobasis also rose across all months as it did for gold. However, unlike in gold, this silver move is against falling prices. This has been our trend for a long while now. Price moves are driven by speculators repositioning. When they sell, we see rising scarcity. When they buy, we see rising abundance (i.e. basis).
That’s what happened in silver this week.
Our calculated fundamental price fell, though not a lot. It’s likely that either the market price drops a buck thirty, or the fundamental price rises (or a combination is possible, of course).
© 2015 Monetary Metals
Keith, Thanks very much for your commentary, it is always appreciated. Could you explain how the fundamental theoretical price is calculated?
Both silver and gold are backwardated. Why is the ‘fundamental’ price below the market price for silver but above for gold?
@petter_w,
fundamental price for silver is not _below_ the market price. Keith said it fells since last week (but remains above market price because of the backwardation.)