
Monetary Metals Supply and Demand Report: 6 Apr, 2014
Are you supposed to buy gold when a bad jobs report is released? On Friday, someone did. Jobs creation fell short of 200K and unemployment ticked up. Silver was bought even more than gold. Someone either bought metal on the disappointing news, or speculated that others will be buying it. Hoarders or speculators? Read on…
First, here is the graph of the metals’ prices.
The Prices of Gold and Silver
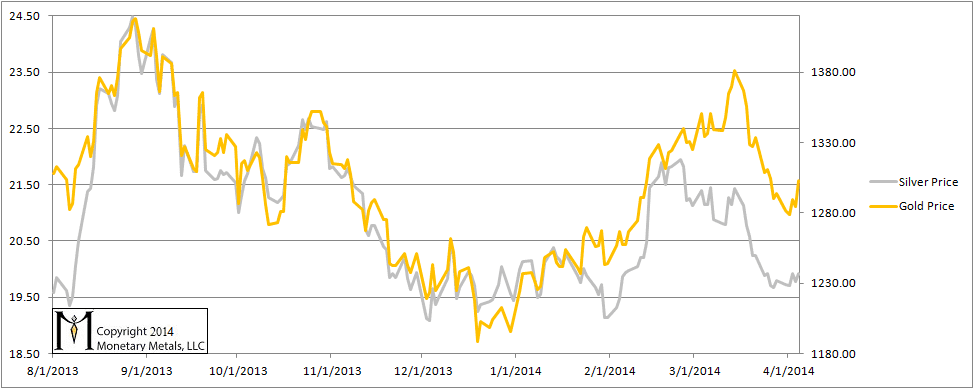
We are interested in the changing equilibrium created when some market participants are accumulating hoards and others are dishoarding. Of course, what makes it exciting is that speculators can (temporarily) exaggerate or fight against the trend. The speculators are often acting on rumors, technical analysis, or partial data about flows into or out of one corner of the market. That kind of information can’t tell them whether the globe, on net, hoarding or dishoarding.
One could point out that gold does not, on net, go into or out of anything. Yes, that is true. But it can come out of hoards and into carry trades. That is what we study. The gold basis tells us about this dynamic.
Conventional techniques for analyzing supply and demand are inapplicable to gold and silver, because the monetary metals have such high inventories. In normal commodities, inventories divided by annual production can be measured in months. The world just does not keep much inventory in wheat or oil.
With gold and silver, stocks to flows is measured in decades. Every ounce of those massive stockpiles is potential supply. Everyone on the planet is potential demand. At the right price. Looking at incremental changes in mine output or electronic manufacturing is not helpful to predict the future prices of the metals. For an introduction and guide to our concepts and theory, click here.
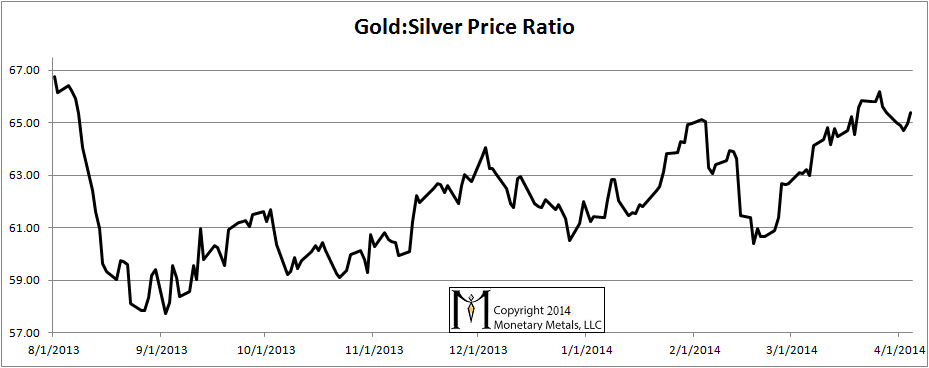
Next, this is a graph of the gold price measured in silver, otherwise known as the gold to silver ratio. The ratio moved around but ended basically unchanged on the week.
The Ratio of the Gold Price to the Silver Price
For each metal, we will look at a graph of the basis and cobasis overlaid with the price of the dollar in terms of the respective metal. It will make it easier to provide terse commentary. The dollar will be represented in green, the basis in blue and cobasis in red.
The green line represents the price of the dollar, measured in gold. Unorthodox, we know. But it paints a far clearer picture of what’s happening than one can get from plotting the price of gold measured in terms of the (failing) dollar. What can you see in this graph of the dollar price overlaid with the gold basis and cobasis?
The Gold Basis and Cobasis and the Dollar Price

The dollar ended the week about 0.2mg lower than it had been (translated into dollar terms, gold “went up” $9). And the cobasis rose. It’s not near backwardation territory yet, but gold became scarcer this week even as its price rose.
The supply and demand fundamentals got a bit more firm this week.
Now let’s look at silver.
The Silver Basis and Cobasis and the Dollar Price
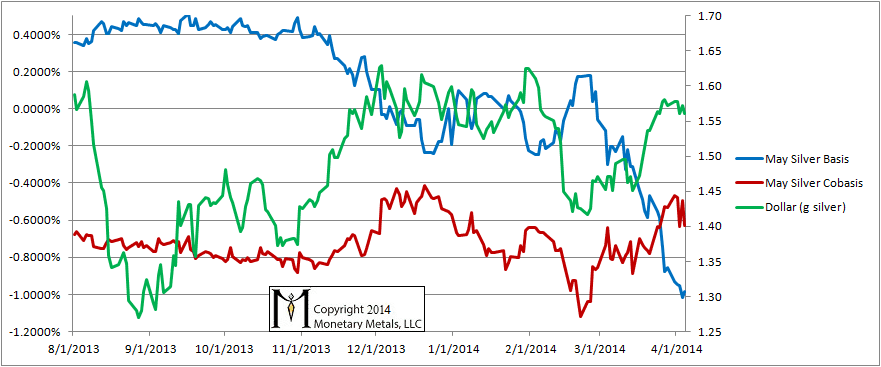
The dollar went down 0.01g in silver terms this week (translation: the silver price went up 13 cents). The cobasis dropped, that is silver became more abundant this week.
© 2014 Monetary Metals
im unable to understand ,can u furder explain,if possible please reply me through mail……………from karachi pakistan