
Monetary Metals Supply and Demand Report: 6 July, 2014
This week was shortened due to the 4th of July holiday in the US.
Still, there were no fireworks in the metals markets, unlike in the sky on Friday evening. The prices of the metals crept up slightly. The supply and demand fundamentals, on the other hand…
First, here is the graph of the metals’ prices.
The Prices of Gold and Silver
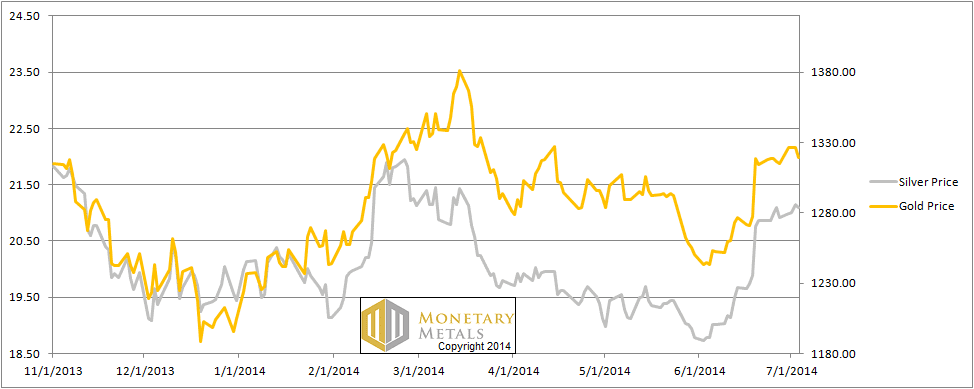
We are interested in the changing equilibrium created when some market participants are accumulating hoards and others are dishoarding. Of course, what makes it exciting is that speculators can (temporarily) exaggerate or fight against the trend. The speculators are often acting on rumors, technical analysis, or partial data about flows into or out of one corner of the market. That kind of information can’t tell them whether the globe, on net, hoarding or dishoarding.
One could point out that gold does not, on net, go into or out of anything. Yes, that is true. But it can come out of hoards and into carry trades. That is what we study. The gold basis tells us about this dynamic.
Conventional techniques for analyzing supply and demand are inapplicable to gold and silver, because the monetary metals have such high inventories. In normal commodities, inventories divided by annual production can be measured in months. The world just does not keep much inventory in wheat or oil.
With gold and silver, stocks to flows is measured in decades. Every ounce of those massive stockpiles is potential supply. Everyone on the planet is potential demand. At the right price. Looking at incremental changes in mine output or electronic manufacturing is not helpful to predict the future prices of the metals. For an introduction and guide to our concepts and theory, click here.
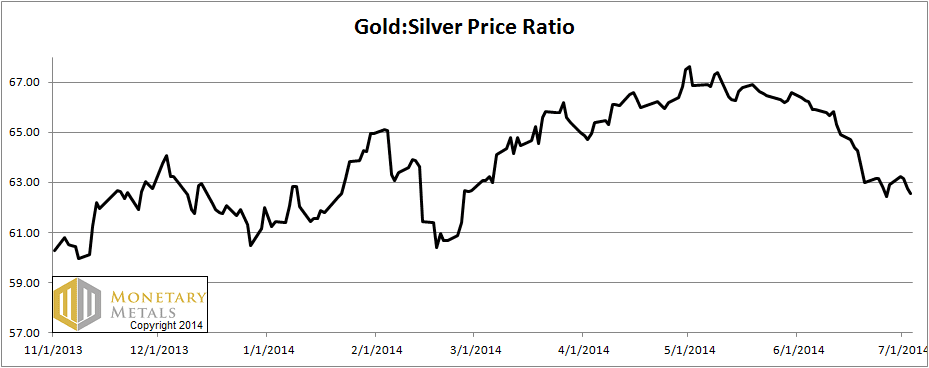
Next, this is a graph of the gold price measured in silver, otherwise known as the gold to silver ratio. The ratio moved down again this week.
The Ratio of the Gold Price to the Silver Price
For each metal, we will look at a graph of the basis and cobasis overlaid with the price of the dollar in terms of the respective metal. It will make it easier to provide terse commentary. The dollar will be represented in green, the basis in blue and cobasis in red.
Here is the gold graph.
The Gold Basis and Cobasis and the Dollar Price
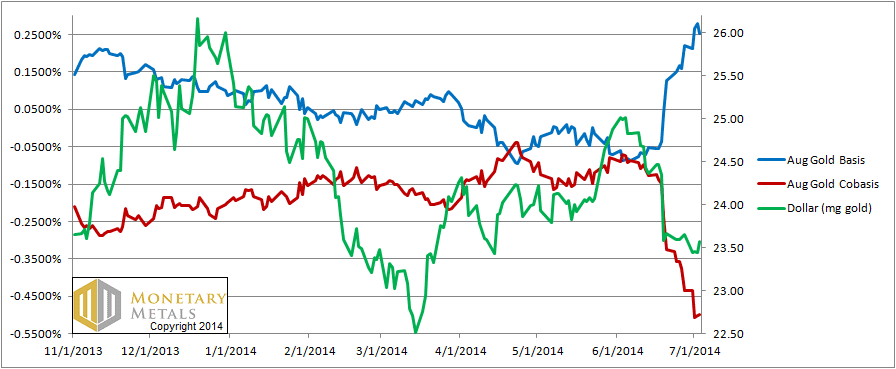
The collapse of the cobasis (scarcity) continues. It was not long ago, that we wrote of the incredible lack of carry opportunity in gold. Now, one can earn 25 basis (annualized) points to buy a bar of gold and sell an August contract. Though it’s worth noting that carry does not rise, as it should, as we go out farther in duration. The December carry is only 22 basis points, and December 2015 is only 30.
In any case, in gold these past few weeks there has been rising abundance and falling scarcity.
Now let’s look at silver.
The Silver Basis and Cobasis and the Dollar Price
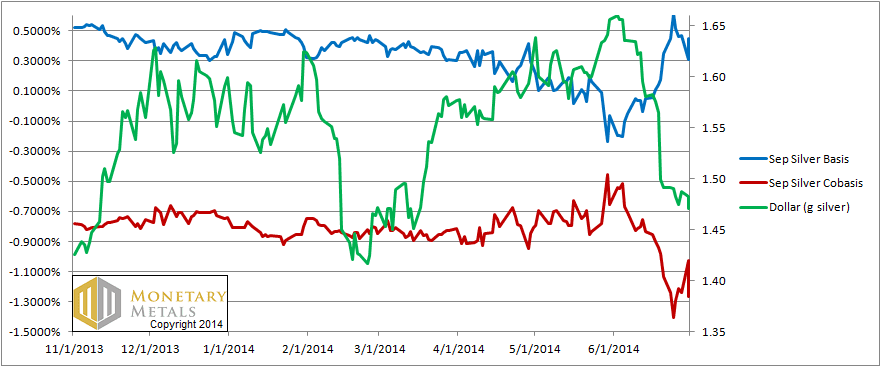
The silver picture moved slightly in the other direction, though the silver carry for Septemeber is 38 basis points, and the decarry is in the abyss. For December, the carry is 77 basis points annualized.
While its fundamentals did not weaken further this week, the data shows that silver continues to have strong supply and weak demand.
We wonder why, if the charts looked so bullish, why the price of silver hasn’t risen more in the past few weeks. One possible reason is that increased buying of futures has been met by increased selling of metal. It takes more buying to continue to push the price up in the face of weakening fundamentals.
Though we think this week has a higher probability of a drop in the silver price, we repeat our advice never to short a monetary metal naked.
© 2014 Monetary Metals
Hi Keith
If possible I would be interested in your thoughts about those who push the …
*manipulation of G &S prices line
* short squeeze line
* That the price has to go up because the price is less than the cost of production line.
Regards
Steve
Scroll back through the site, I have written numerous articles debunking various aspects of the manipulation conspiracy theory.
As to the cost of production, the answer is simple. The stocks to flows ratio (inventory divided by annual mine production) is measured in decades for gold (as compared to months for any normal commodity). Gold is not consumed, and all of the gold mined in human history is basically still in human hands. Gold miners could shut down (or double their production) tomorrow and it would hardly affect the gold price.
I figured you would say something like that. Ive read all your articles.
What I was getting at is how is it that these advisor types can get it so wrong on supply/demand, short squeezes and manipulation conspiracy thinking.
** re gold mines shutting down…if its too costly to mine why don’t they go buy gold on the open market.
Good questions! :)