
Monetary Metals Supply and Demand Report: 7 June, 2015
The world is still a mess, just as much as it was last week. Despite that, the price of gold fell $18 and the price of silver fell $0.63. What’s going on? Are the central banks putting the kibosh on the monetary metals?
One view is that they don’t want to let people use cash any more, and so people will turn to gold and silver (Keith plans to write about the coming war on cash for his column, The Gold Standard). The prices of the metals have fallen considerably in the last three weeks: over $50 in gold and over $1.50 in silver.
Read on for the only accurate picture of supply and demand, and an explanation of what happened…
First, here is the graph of the metals’ prices.
The Prices of Gold and Silver
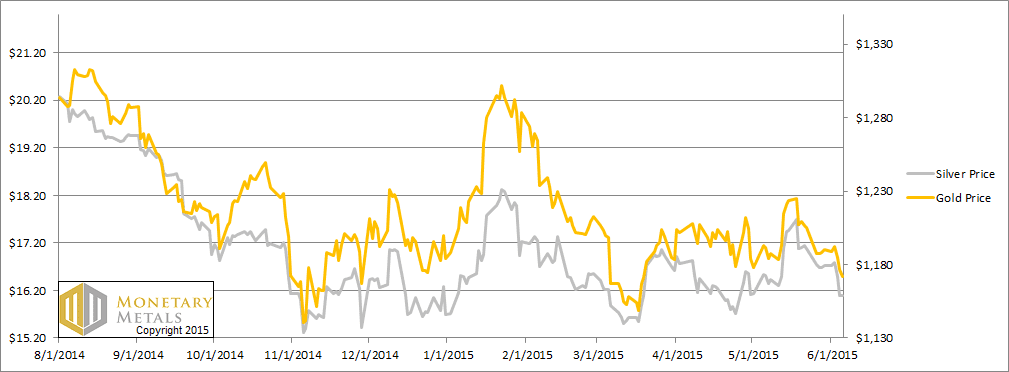
We are interested in the changing equilibrium created when some market participants are accumulating hoards and others are dishoarding. Of course, what makes it exciting is that speculators can (temporarily) exaggerate or fight against the trend. The speculators are often acting on rumors, technical analysis, or partial data about flows into or out of one corner of the market. That kind of information can’t tell them whether the globe, on net, is hoarding or dishoarding.
One could point out that gold does not, on net, go into or out of anything. Yes, that is true. But it can come out of hoards and into carry trades. That is what we study. The gold basis tells us about this dynamic.
Conventional techniques for analyzing supply and demand are inapplicable to gold and silver, because the monetary metals have such high inventories. In normal commodities, inventories divided by annual production (stocks to flows) can be measured in months. The world just does not keep much inventory in wheat or oil.
With gold and silver, stocks to flows is measured in decades. Every ounce of those massive stockpiles is potential supply. Everyone on the planet is potential demand. At the right price, and under the right conditions. Looking at incremental changes in mine output or electronic manufacturing is not helpful to predict the future prices of the metals. For an introduction and guide to our concepts and theory, click here.
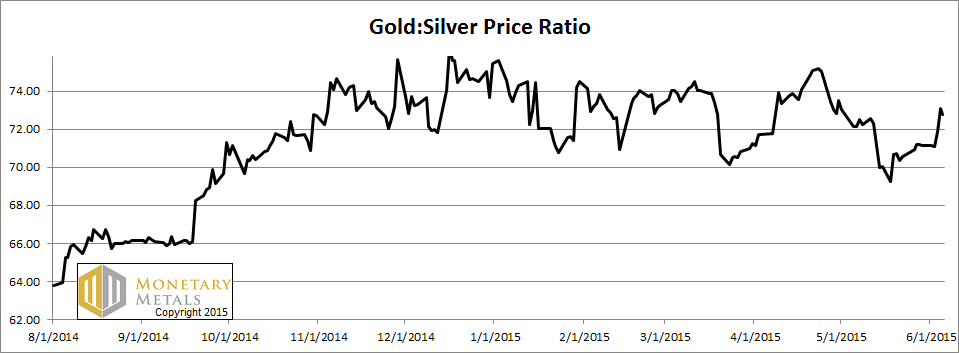
Next, this is a graph of the gold price measured in silver, otherwise known as the gold to silver ratio. It moved up again this week.
The Ratio of the Gold Price to the Silver Price
For each metal, we will look at a graph of the basis and cobasis overlaid with the price of the dollar in terms of the respective metal. It will make it easier to provide brief commentary. The dollar will be represented in green, the basis in blue and cobasis in red.
Here is the gold graph.
The Gold Basis and Cobasis and the Dollar Price
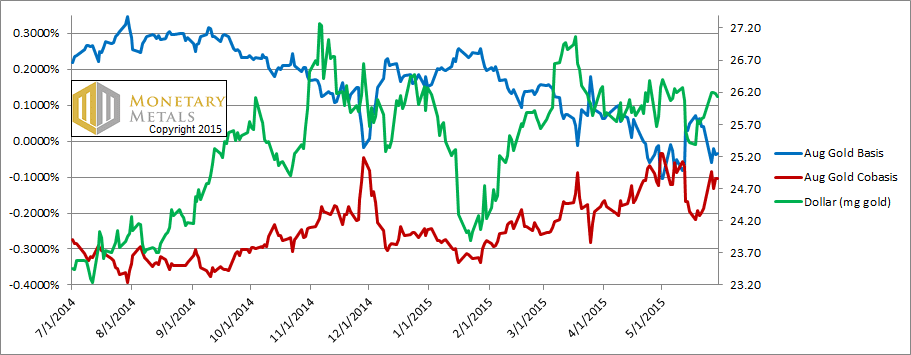
Look at the plunge in abundance (the blue line, i.e. the basis) and the sharp rise in scarcity (the red line, i.e. the cobasis). Similar moves occurred in farther-out contracts.
These moves mirror the move up in the dollar, +0.4mg gold to 26.6. As the dollar rises, we see the scarcity of gold rising. It’s logical that, as the dollar rises, fewer people want to buy it (otherwise known as selling their gold metal). In other words, the price drop was driven once again by the selling of futures.
Our fundamental price actually moved up a few bucks this week.
Now let’s look at silver.
The Silver Basis and Cobasis and the Dollar Price
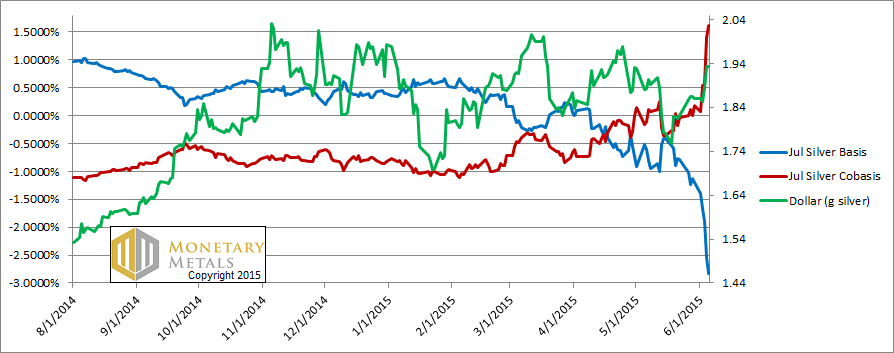
It looks like a gigantic move, with the cobasis up to +1.6%. However, it is heavily biased towards the near contract (which goes First Notice Day in a few weeks) and the next one out. Temporary backwardation is like a reality distortion field, and the effect is more pronounced in silver than in gold, owing to its lesser liquidity.
This move downwards in the silver price was somewhat driven by speculators selling futures. There was also a component of selling metal. Unlike in gold, our calculated fundamental price dropped. It’s down another 20 cents, half a buck or so below the current market price.
We’re getting closer, both in terms of time and price.
© 2015 Monetary Metals
You mean “because the world’s still a mess, the price of gold dropped”.
As liquidity tightens and the level of counter-party trust declines, gold will flow from those who need cash to those who have cash, who will then sell it to get cash again.
The mechanics of posting collateral have changed over the past 20 years. It used to be that the party posting collateral kept title to the asset. Sometime in the 1990’s it changed to where the party posting collateral also hands over title to the asset; the receiving party then sells it and buys an option to replace it. This only makes sense. The receiving party isn’t going to make any money holding gold and it can only loan it out once. Cash they can re-loan every night.
There is undoubtedly another big drop in gold coming as the liquidity tightening at some point reaches a crisis.