
Monetary Metals Supply and Demand Report: 7 Sep, 2014
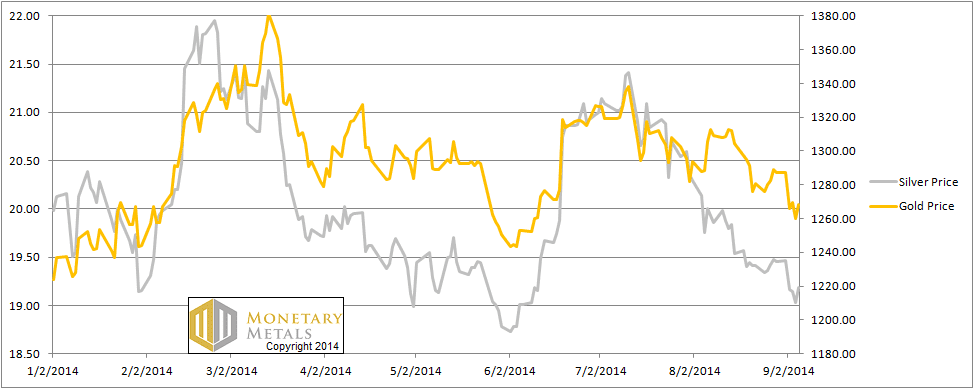
The gold price dropped by $19, and the silver price by $0.26 this week.
There was a bit of a rally on Friday, following a bad payroll report. We suppose the logic is that job creation is anemic, therefore the Fed will have to print more, therefore the money supply will increase, therefore gold and silver have to “go up”. Maybe the speculators trying to front-run the demand they anticipate are right this time? Read on…
First, here is the graph of the metals’ prices.
The Prices of Gold and Silver
We are interested in the changing equilibrium created when some market participants are accumulating hoards and others are dishoarding. Of course, what makes it exciting is that speculators can (temporarily) exaggerate or fight against the trend. The speculators are often acting on rumors, technical analysis, or partial data about flows into or out of one corner of the market. That kind of information can’t tell them whether the globe, on net, hoarding or dishoarding.
One could point out that gold does not, on net, go into or out of anything. Yes, that is true. But it can come out of hoards and into carry trades. That is what we study. The gold basis tells us about this dynamic.
Conventional techniques for analyzing supply and demand are inapplicable to gold and silver, because the monetary metals have such high inventories. In normal commodities, inventories divided by annual production can be measured in months. The world just does not keep much inventory in wheat or oil.
With gold and silver, stocks to flows is measured in decades. Every ounce of those massive stockpiles is potential supply. Everyone on the planet is potential demand. At the right price. Looking at incremental changes in mine output or electronic manufacturing is not helpful to predict the future prices of the metals. For an introduction and guide to our concepts and theory, click here.
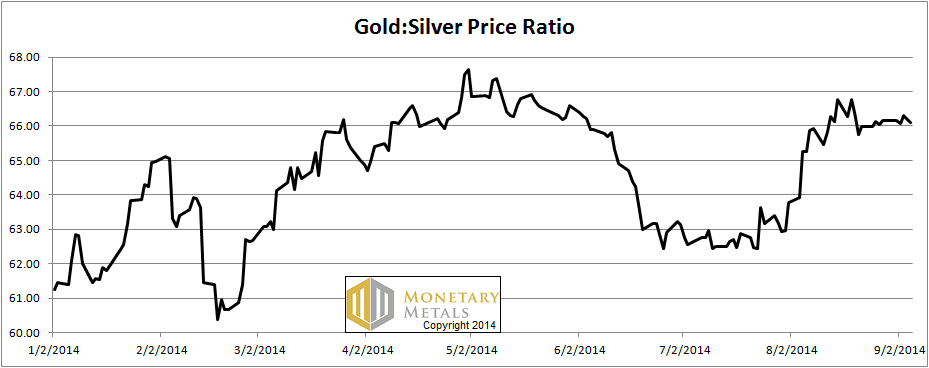
Next, this is a graph of the gold price measured in silver, otherwise known as the gold to silver ratio. The ratio moved down a hair.
The Ratio of the Gold Price to the Silver Price
For each metal, we will look at a graph of the basis and cobasis overlaid with the price of the dollar in terms of the respective metal. It will make it easier to provide terse commentary. The dollar will be represented in green, the basis in blue and cobasis in red.
Here is the gold graph.
The Gold Basis and Cobasis and the Dollar Price
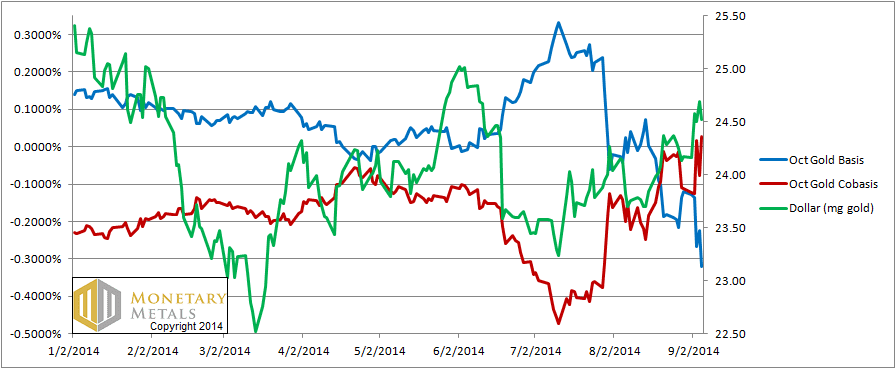
The cobasis (i.e. scarcity) and the dollar price (i.e. inverse of the gold price measured in dollars) continued their correlation. The dollar price rose to a new high for the move, 24.69mg by the close on Thursday, and the cobasis rose to +0.03% on Friday morning (US time).
We now have a small temporary backwardation in gold.
Speculators have sold gold futures down, so now (at $1265) there is a hint of more serious scarcity developing. This does not mean the price couldn’t go lower, but it will be a force pushing upwards on the gold price. If the backwardation increases, that force will increase.
If we had to take a guess, we would say that the upward bounce in the gold price had nothing to do with unemployment and everything to so with gold being sold down a bit too far.
Now let’s look at silver.
The Silver Basis and Cobasis and the Dollar Price
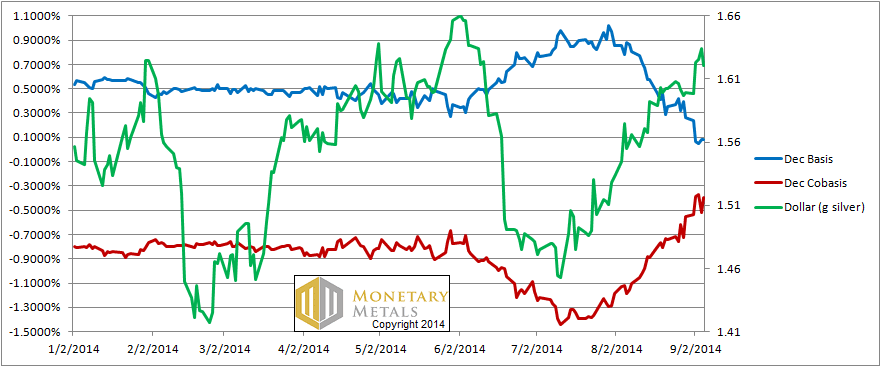
The same story is playing out in silver. The dollar price (i.e. inverse of the silver price measured in dollars) increased from 1.60g to 1.62g this week. The cobasis (i.e. scarcity) increased from -0.6% to -0.4%. The difference between silver and gold is the absolute level of the silver cobasis is lower (the Dec gold cobasis is -0.2%).
© 2014 Monetary Metals
Keith,
Any idea why the gold cobasis is in backwardation but the GOFO is not even close?
Thanks,
Mark
Mark,
Very good question.
GOFO is a continuous 30-day (and they have longer maturities as well) quote. By contrast, futures contracts have discrete expiration dates. As we get close to the expiration date of a particular contract, there is selling pressure on that contract. Those who are long the contract to speculate on the price must sell (they can buy a farther-out contract if they wish to remain long).
This is the force that drives what I call “temporary backwardation”.
Keith,
Thanks. The thing that doesn’t make sense to me is that as the price of gold has fallen the past 4 days, all GOFO periods have gone more positive. It would appear from that either gold is no longer in backwardation or the LBMA data on GOFO is wrong. Any thoughts?
Thanks,
Mark