We’re seeing the argument, again, that silver stocks are being consumed in solar panels, medical applications, and of course, electronics. This argument has a certain temptation. After all, the standard assumption is that value is inversely proportional to quantity. Purchasing power is widely believed to be 1 / N (N is number of units of currency issued). So, logically, if stocks are decreasing, then silver is becoming scarcer, and they deduce that it is becoming more valuable.
This is a good example of Motivated Reasoning, that is the “tendency to find arguments in favor of conclusions we want to believe…”
Is Silver being Demonetized?
Something needs to be said up front. And it is obvious to even casual observers. The dollar has (by far) the greatest quantity, and yet far from the least purchasing power. It is one of the strongest currencies, despite—or perhaps because of—this fact.
Also, as a corollary, the price of silver measured in dollars, does not go up as a function of increases in the quantity of dollars. Therefore, the logic of silver becoming more valuable strictly on account of its decreasing quantity is broken.
More importantly, this argument argues that silver is being demonetized. It is saying that the commodity formerly known as “money” is being put into consumer goods and, eventually, landfills. That is, people are disposing the stocks of money accumulated over 5,000 years of human action.
If you were trying to build a bullish case for silver, based on its expected role in a new monetary system, this argument would undermine that case. Either silver will likely play a role, and hence buying it now is a non-expiring call option on this expected monetary change. Or else silver is being thrown away, forgotten and unlamented. Take your pick, one or the other.
Some people who tout this kind of argument don’t give a sh*t about the future of the monetary system. They are either in the game for a quick trade, to make what they deem to be real money—i.e. dollars. Or else they are silver spruikers, trying to get you to buy silver, from which they may benefit.
But many are sincere. They come to silver (and gold) because the dollar is obviously, visibly, failing (though not via skyrocketing consumer prices). Interest has all but been euthanized, along with savers, retirees, pension funds, and insurers. The dollar’s managers are taking more and more extreme actions to try to stave off catastrophe, while at the same time loudly proclaiming that there’s nothing wrong, the economy is fine, nothing to see here, move along folks.
So these folks buy silver, thinking about monetary change. But a funny thing happens on the way to said monetary change. SILVER IS GOING UP! It’s easy to lose sight of where things are headed, and why we took what might have been an inconceivable action before 2008—buying silver—because the price action is exciting. And if you time it right, you can get free dollars which can buy real food, real housing, and real Ferraris.
We certainly don’t fault people for trading silver. Speculating for price gain is the surrogate for the yield which has been killed by the Fed (Monetary Metals pays a yield on gold and silver). Our quibble is when they make arguments which undermine the whole Purpose of the precious metals movement: that the monetary metals are money.
Understanding Central Banks Buying and Selling of Gold
Another argument, this one is coming up for gold again, is that Central Bank X bought X tons of gold in June. The implication is that this is bullish. We aren’t sure if those arguing this are trying to make you believe that central bankers are smarter than everyone else, and therefore you should follow them in placing your bets. We can say with confidence, however: they aren’t smarter.
More often, those who argue this way are trying a variant of the scarcity argument. In other words, the central banks just took X tons of gold off the market, therefore the price should rise.
It should be obvious that central banks can just as easily sell what they bought. So this is not necessarily taking gold off the market.
Our main point about this is, perhaps, less obvious. The quantity of gold does not change in a transaction. If a central bank bought X tons of gold, then someone sold X tons of gold. We ask the rhetorical question, why do these gold commentators never write headlines like this: “Thousands of Random People Dump X Tons of Gold Onto Hapless Central Bank”?
Some transactions are correctly characterized as a motivated buyer buying gold off a gold owner. Others are correctly described as a motivated owner selling it onto another party. What factor determines which is correct? That factor is not: whichever party is more famous.
That factor is: the price action. If a buyer is motivated, he lifts the seller’s offer. The offer price ticks up. Conversely, if a seller is motivated, he presses the buyer’s bid. The bid price ticks down.
What do we know about this central bank action in June? We know the price was falling during the month. Therefore, the latter is true. Sellers dumped their gold onto the central bank bid.
Monetary Metals is the exclusive publisher of supply and demand fundamentals and dozens of other charts of market data, that helps traders cut through the noise to understand what’s really going on. We don’t believe that misinformation makes any difference to price, other than in the shortest time horizon. If anything, it causes the price to be depressed over the longer-term as it may cause many people to give up on owning precious metals.
Supply and Demand Fundamentals for the Gold Price
Here is the gold chart, zoomed into show 60 days of the near contract.
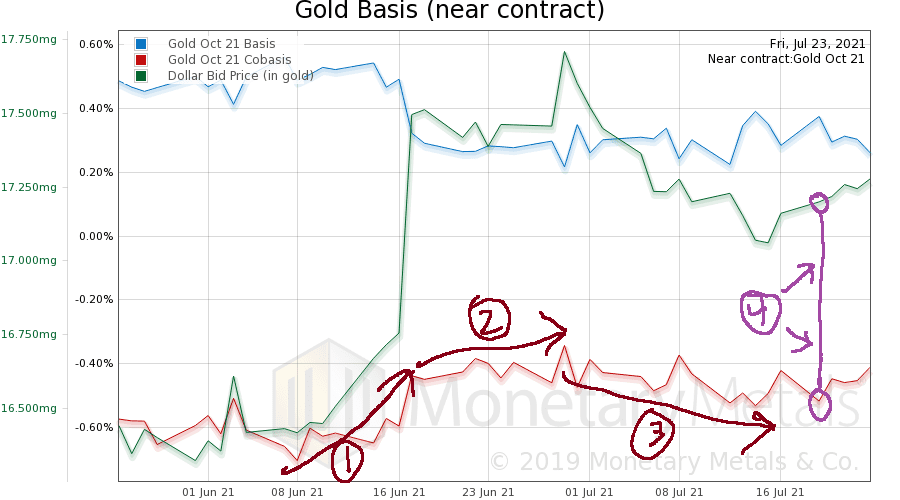
We have marked it up to show different patterns in different periods. In (1), we see a very large increase in the price of the dollar (we argue at length, that measuring the dollar in terms of gold and not measuring gold in terms of the dollar, is no mere tendentious point, but the only way to see gold and the dollar clearly). A rising price of the dollar in gold terms means a drop in the price of gold measured in dollars. As this price move occurred, gold became somewhat scarcer. Our measure of scarcity, the cobasis, rose from around -0.70% to -0.44%.
Next, in region (2), the price of the dollar is sideways to down. But the scarcity of gold continues to rise. At the end of this phase, there’s another sizeable blip up in the dollar, with a smaller but noticeable blip up in gold’s scarcity.
In (3), the price of the dollar drops about half as much as it had gains. Technical chartists may read meaning into such a 50% retracement, but that is not our focus. We are just looking at the fact that gold became less scarce during this price move (this was also about a 50% retracement).
It is notable that the proportionality is holding. This means that the price moves are largely driven by leveraged speculators who are positioning and repositioning themselves based on their expectations of the next price move, plus their increasing or decreasing access to credit, margin calls on other assets, etc.
But this week, something changed. Look at the point labelled (4) on Monday, though this pattern continued on Wednesday. We see the dollar went up (i.e. the price of gold went down) but the scarcity of gold market went down. Gold became more abundant to the market when its price dropped.
This is selling of bars and coins, not futures. Not what you want to see, if you’re making a bullish bet on the price of gold.
Now let’s look at silver.
Supply and Demand Fundamentals for the Silver Price

The price action of silver is similar to gold. But the basis action is a bit different. The cobasis moves along with the price. There is even a day (July 5) when the cobasis moves up—silver became scarcer—when the dollar went down. That shows buying of coins and bars.
So let’s look at a chart we don’t include in this Report very often (though it is updated on our website every day). This one shows the ratio of the gold basis to the silver basis, and the gold cobasis to the silver cobasis. In other words, it shows which precious metal is relatively more abundant or scarce. And the trend.
This chart is zoomed out to show the start of the covid lockdown through present.

As we have discussed before, the spreads went wild in the immediate aftermath of lockdown. They have been in a process of converging to whatever the new normal is (as we showed last time, the bid-ask spreads are wider than before).
Since June 11, the ratios have been moving in favor of silver. That is, the ratio of the gold cobasis to the silver cobasis is falling, and the ratio of their bases is rising. This means that, relative to gold, silver is becoming less abundant and more scarce. Notably during this time, the gold-silver price ratio rose 5 points.
Additional Information
Curious about how we calculate the Supply and Demand Fundamentals for Gold and Silver? Start Here!
Want to learn more about how we value gold and silver and what our calls are for 2021? Check out our Outlook for Gold 2021