
Perhaps it may be lesser known than his other Laws, but Murphy wrote one for the basis analysis. It goes like this. If we observe that the fundamental price of a metal is far removed from the market price, the two won’t likely converge the next week. On the other hand, suppose we say this (as we did last week):
“The Monetary Metals fundamental price is measuring just that, the fundamentals. As with stocks or any other asset, our centrally banked, government-distorted markets can experience price volatility and even prices that deviate from the fundamentals for a long period of time. Just because we have been calculating a fundamental price for gold that is well over a hundred bucks above the market price, does not mean that the market price has to spike up $100 tomorrow morning. It might—and we certainly would not short gold when the market is in such a state. But as the market has proven since August, it might remain depressed for quite a while.”
Then something is bound to happen the next week.
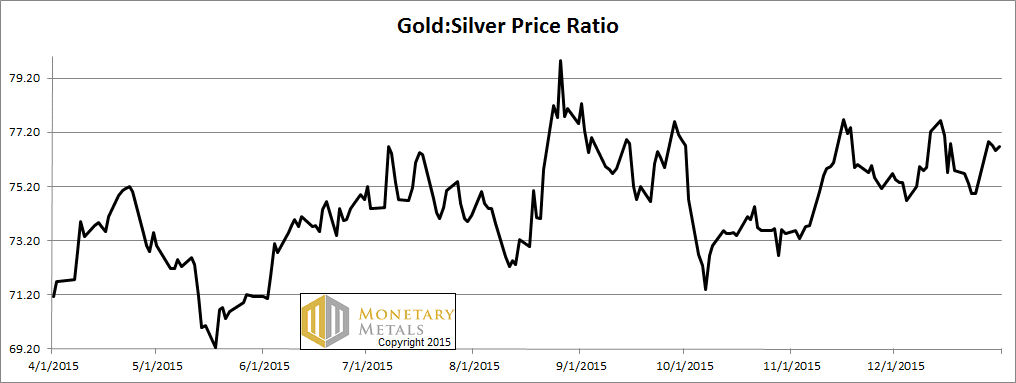
No, the price of gold did not shoot up to approach our published fundamental. The gold-silver ratio promptly moved up +2.3%. As readers will recall, we have been calling for a ratio value over 80 for a while.
Read on for the only true look at the fundamentals of gold and silver…
But first, here’s the graph of the metals’ prices.
The Prices of Gold and Silver

We are interested in the changing equilibrium created when some market participants are accumulating hoards and others are dishoarding. Of course, what makes it exciting is that speculators can (temporarily) exaggerate or fight against the trend. The speculators are often acting on rumors, technical analysis, or partial data about flows into or out of one corner of the market. That kind of information can’t tell them whether the globe, on net, is hoarding or dishoarding.
One could point out that gold does not, on net, go into or out of anything. Yes, that is true. But it can come out of hoards and into carry trades. That is what we study. The gold basis tells us about this dynamic.
Conventional techniques for analyzing supply and demand are inapplicable to gold and silver, because the monetary metals have such high inventories. In normal commodities, inventories divided by annual production (stocks to flows) can be measured in months. The world just does not keep much inventory in wheat or oil.
With gold and silver, stocks to flows is measured in decades. Every ounce of those massive stockpiles is potential supply. Everyone on the planet is potential demand. At the right price, and under the right conditions. Looking at incremental changes in mine output or electronic manufacturing is not helpful to predict the future prices of the metals. For an introduction and guide to our concepts and theory, click here.
Next, this is a graph of the gold price measured in silver, otherwise known as the gold to silver ratio. The ratio jumped up this week.
The Ratio of the Gold Price to the Silver Price
For each metal, we will look at a graph of the basis and cobasis overlaid with the price of the dollar in terms of the respective metal. It will make it easier to provide brief commentary. The dollar will be represented in green, the basis in blue and cobasis in red.
Here is the gold graph.
The Gold Basis and Cobasis and the Dollar Price
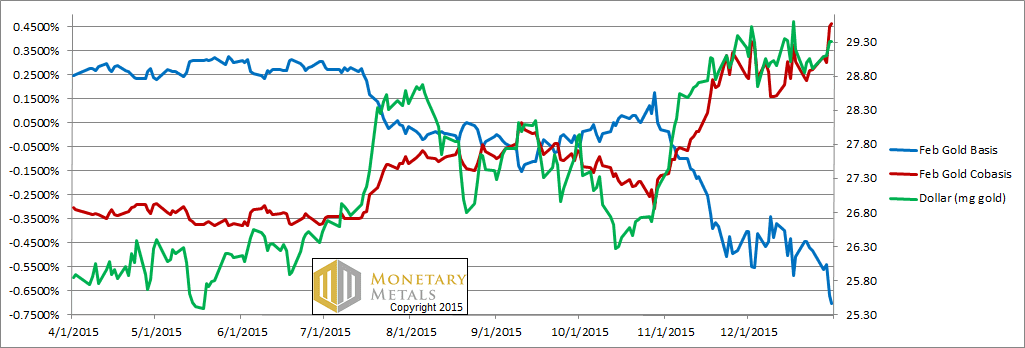
The cobasis (i.e. scarcity of gold) rose more than the dollar (which is the inverse of the price of gold). In other words, the gold price fell a few bucks but the metal became more scarce. By the way, the above graph had to be rescaled to make the higher cobasis fit. The move in the cobasis would appear larger on the scale used last week.
Not only is the Feb contract backwardated, but so is Apr. As long speculators are selling Feb to buy Apr, the latter backwardation is more notable.
The fundamental price jumped up this week, with most of the action on Wednesday.
Now let’s look at silver.
The Silver Basis and Cobasis and the Dollar Price

The price of the dollar in silver terms moved up considerably more than the price in gold terms. Conventional analysis would say that silver fell 52 cents, but we reject that view. The dollar is not the economic constant.
While the scarcity of silver rose a bit in response, it didn’t rise that much. The May silver contract is nowhere near backwardated.
Unfortunately for silver bugs, the fundamental price for silver fell 25 cents this week. This puts it above the market price, but not by a large margin.
It also means the fundamental price of the gold-silver ratio went up. We are almost embarrassed to say what it is now. Suffice to say, quite a lot higher than the market ratio of 76.7, as of Thursday…
Make sure to subscribe to our YouTube Channel to check out all our Media Appearances, Podcast Episodes and more!
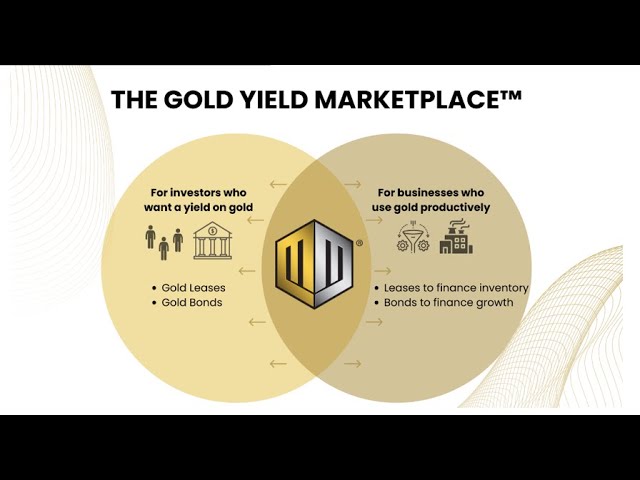
Additional Resources for Earning Interest on Gold
If you’d like to learn more about how to earn interest on gold with Monetary Metals, check out the following resources:
In this paper we look at how conventional gold holdings stack up to Monetary Metals Investments, which offer a Yield on Gold, Paid in Gold®. We compare retail coins, vault storage, the popular ETF – GLD, and mining stocks against Monetary Metals’ True Gold Leases.

The Case for Gold Yield in Investment Portfolios
Adding gold to a diversified portfolio of assets reduces volatility and increases returns. But how much and what about the ongoing costs? What changes when gold pays a yield? This paper answers those questions using data going back to 1972.


The part on Murphy’s law (which I did not know about) and your conclusion drew my attention. And as far as things stand right now – it is Monday morning 10.00 o’clock in Holland now – you may be right. As up to now, you often were. Gold up in $ 1.1%, silver in $ also 1.1%, but in € gold and silver both 0.5%. And I have to admit that I know too little about your cobasis. Have you been publishing a special paper on this cobasis? Of course I’ve seen your regular articles on this site and others about it and more or less understand what you are talking about. But as a long time ago I read your dissertation I wonder if you wrote a special paper on this topic. See me as a slow learner and somebody who would like to get a better understanding on this matter. Which also brings me to your ‘gold backed bonds’. Did you write a special paper on that matter too? If so, would you kindly direct me to these papers? And then as a last question, do you have any idea on how much hoarding of gold there really is?
I realise these may sound like silly questions, but nevertheless I’m still in the phase that for my own feeling I do not understand these items in depth enough to be worthy speaking partner.
chidecki: The silver price has sagged while the gold price remains much closer to its peak a few hours ago (it is 11am AZ time as I write this). Over the short term, price moves can be almost random. Over the long term, we shall see..
I have published lots of material on the cobasis, one of which is linked in the boilerplate section of the Report every week. Also, see last year’s Outlook 2015 for a deeper discussion of the theory.
I wrote this on gold bonds: http://keithweinereconomics.com/2012/02/02/gold-bonds-to-avert-financial-armageddon/
I argue that it’s impossible to estimate true gold stocks (hoards). People have been hiding gold from their governments and their neighbors for thousands of years. We can only say “a lot”. :)
Thanks Keith, much appreciated.