
Putting the Latest Silver Crash Under a Lens
On Thursday, July 6, in the late afternoon (as reckoned in Arizona), the price of silver crashed. The move was very brief, but very intense. The price hit a low under $14.40 before recovering to around $15.80 which is about 20 cents lower than where it started.
Buyers of silver are rejoicing. They can now get more money (silver, like gold, is money) in exchange for their dollars than before. However, as we see from the reactions in the community, there were few buyers.
Cries of woe are heard everywhere. Those who are crying are sellers, including those who say they don’t plan to sell but who really want a high price in case they change their mind by Monday morning.
If you want to see what it looks like when everyone is thinking of buying, look at the bitcoin market when there is a price drop. The enthusiasm is palpable. Everyone is gloating about buying the dips, with faith unbroken that the cryptocurrency is on its way to shoot past $10,000 if not $1,000,000.
Gold and silver are the opposite. For now. And perhaps that is a sign that here is a good opportunity. Blood in the streets, as the expression goes.
The purpose of this article is to look deeply into the trading action at the time of the crash. First, here is a graph showing the bid and offer prices for about 50 seconds. The horizontal axis shows time, but it is ticks rather than seconds or milliseconds. So, for example, it does not show the 10-second period when CME halted the exchange.
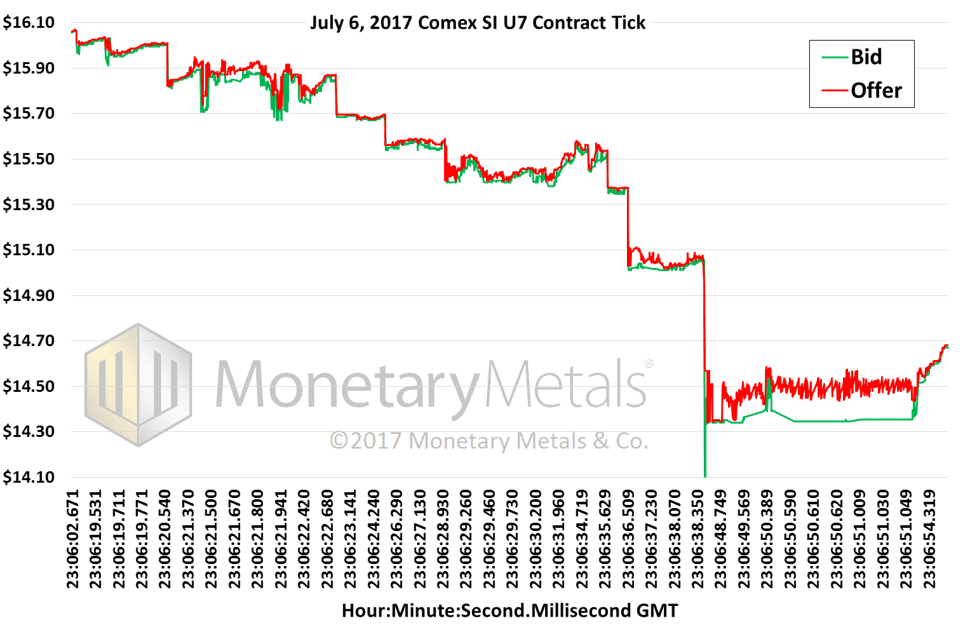
For most of this time period, there is an orderly market as seen in the tight bid-offer spread, though even from the start we observe that on price drops the bid drops more. That becomes extreme where the bid hits $14.10 (which occurs right after the halt). From that point onwards, we see a very wide bid-offer spread. The bid looks to be held low deliberately, around $14.33, while the offer is moving around as buyers begin lifting it.
Let’s address the wide spread. The banks have been under assault for their trading practices. Among other things, they are blamed for having proprietary positions, for “leaking” information during the Fixing, for having a too-large position, etc. The net result is to push the compliance department into prominence. No longer can the bank act when the market offers a profitable opportunity for arbitrage.
Arbitrage causes spreads to tighten, as part of the process of making money.
But before a bank may arbitrage something, they must weigh their proposed trade against the new regulations. And of course, always they must be aware of the optics. It does them no good to make a perfectly legal trade that will bring resentment, more regulatory scrutiny, and possibly litigation.
For example, what is the difference between a “prop” (proprietary) trade, and ordinary market-maker arbitrage? Don’t bother trying to answer this question. Unless you are a commodities lawyer who is intimately familiar with the regulations as they existed on July 6, and also familiar with the current interpretations of the regulators, you cannot answer. Regulations can make distinctions between two maddeningly similar actions, or even identical actions in confusingly similar contexts. On one side of the distinction lies your right to earn a profit. On the other side is regulatory action, penalties, brand damage, and possibly an extended visit to prison.
With such large differences in outcomes, based on such fine lines between actions, you can bet that the banks are backing away from trades they would otherwise take. They are becoming more conservative and making less money. And leaving the market less efficient, more costly to do business in, and more volatile.
In this light, we submit for your consideration the fact that after 23:06:50 the banks were leaving 10 to 12 cents per ounce on the table. That is an attractive profit for a market maker, and it takes a powerful force to keep them from wanting to earn it.
Ironically, the net result of all this pressure on the banks is the opposite of what the gold and silver community wants. It does not cause the price to rise. Instead, it contributes to two other phenomena. One is higher volatility. Crashes like this occur when the stack of bids is thin. That is precisely what happens when banks are under pressure to stand back.
Two is rising costs. The bid-offer spread is the cost of a round-trip. It is one measure of the friction in the market. This cost affects traders, producers, and consumers of metal. Silver has long been the most hoardable commodity for workers to set aside part of their weekly wages, because its spread is the narrowest for the quantities involved. These regulations are undermining silver for this use.
A word on the thin market. Unlike the June 26 crash on (which we wrote about), this one occurred when Europe was asleep and the US was mostly offline. Markets were open in Sydney, and perhaps a few early risers in Asia (7am in China). However, in a liquid market, there would be little impact to such selling even then. Indeed we see in gold, the price drop was $5—hardly worth writing an article about.
Regulations imposed on prop trading, insider trading, position limits, asset reservation, and other aspects of running a market making operation drive down liquidity. Whether this move was triggered by stop-loss orders or something nefarious, we do not know (we can only say that we see no reason why governments or central banks would care about the price of silver).
Here is a chart of what happened in the one minute after 11:06pm GMT, millisecond (1/1000th of a second) by millisecond, showing volume-weighted average price overlaid on number of contracts traded.
![]()
At this time scale, we can see there are upticks. Yes even in a crash like this one, there are upticks.
To reiterate what we said in our last forensic analysis of a crash, in a free market there would be no such thing as gold or silver. The futures market is for goods that are produced seasonally, but consumed throughout the year. It is a market for warehousing.
There would be an interest-rate market for gold, i.e. a bond market. A gold futures market is a bizarre creature, created by the artificial environment of irredeemable currencies and laws that force everyone to use them.
In that context, a futures market for gold makes sense in a way. It is a way to bet on the price action, to generate profits in dollars. Like all other derivatives markets, the gold futures market offers leverage so that traders can maximize profits even when price moves are small.
Of course, big leveraged positions mean big risk. That is why they must set tight stop-loss orders. This is one possible explanation for the crash. Initial selling triggered stop orders, and those triggered others, and with a thin stack of bids, whoosh.
And it is also the basis (no pun intended) of our basis analysis. We like to see how much these leveraged bettors are moving the price.
This brings us to the unique Monetary Metals analysis. If the price of spot is falling relative to futures, then we know there was selling of spot. If the price of futures is falling relative to spot, then we know there was selling of futures.
This spread, future price – spot price, is called the basis.
Below is a chart of the silver price overlaid with the September silver basis from 10pm to midnight GMT.
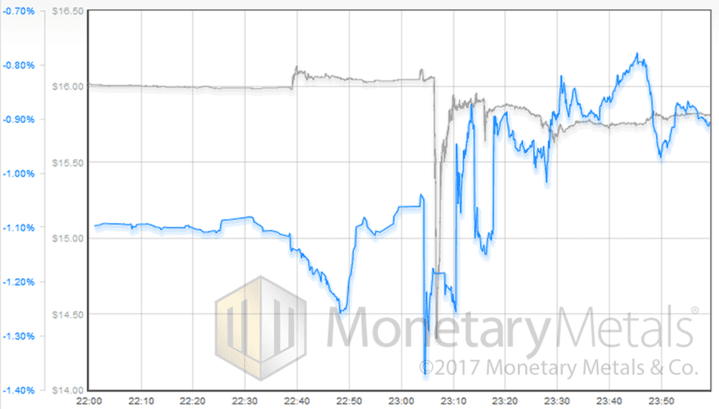
No question, we see selling of futures. Whether these are stop-loss orders or something else, we don’t have the data to say. What is certain is that the basis drops twice. First, just prior to 22:40 when the price is rising. There is some buying of metal here. But then that buying fades and is replaced by buying of futures, thus the basis recovers and rises about 5bps above its initial level.
Then the basis drops, starting just prior to the price drop. So the first bit of selling of futures appears as a drop in the futures price relative to spot, though price does not move much initially. Then the thin bid is pierced, and the price goes over the edge of the cliff.
The basis begins rising, going more +30bps over its starting point. This is a frenzy of buying—of paper (futures).
Other than that brief blip up in price from around $15.88 to $16.10, this episode was not about physical metal.
Monetary Metals will be exhibiting and FreedomFest in Las Vegas in July. If you are an investor and would like a meeting there, please click here.
© 2017 Monetary Metals


Hi Keith. Interesting analysis, as always. I keep hoping to find an update from you on the SGE. A lot of analysts seem to think the establishment for pricing shifting to Shanghai is a really big deal. I’m skeptical about early conclusions like that, but surprised to see the rather large arbitrage forming between gold priced in the West vs. gold priced in the East. As of today, the discount for Eastern gold is $109/oz.