
Silver Market Change Report 5 July, 2015
The prices of the metals drooped further this shortened week (Friday was a holiday in the US, as the Fourth of July, Independence Day, occurred on Saturday). The S&P 500 index also fell this week, as did crude oil.
Markets all over the world are beginning to feel shocks from Greece. As we write this, on Sunday evening Arizona time, the Greeks voted “No” to the terms of the bailouts offered them. The simple fact is that Greece cannot pay. What they cannot pay, they will not. What they don’t pay, has to be written off by whomever holds it as an asset. Some of these write-offs will obligate European governments to pay in more euros to recapitalize the now-insolvent entities. For example, countries like Spain that need bailouts themselves will have to contribute to the European Central Bank.
A Greek default is not about the size of its GDP, but about the size of the holes blown out of various balance sheets, where Greek debts used to be marked as their assets. We don’t know precisely how much the Greek government, Greek central bank, Greek commercial banks, and other Greek debtors owe. According to Demonocracy, the total is €360 billion (and they have a very cool infographic to illustrate it). We suspect that, at the end of the day, the number turns out to be greater than that.
The Greek default is a forcible contraction of credit (Keith’s definition of deflation), and bound to be negative for the prices of ordinary assets. That said, something extraordinary has occurred in the silver market this week.
Read on, for the only accurate picture of the supply and demand conditions in the gold and silver markets, based on the basis and cobasis.
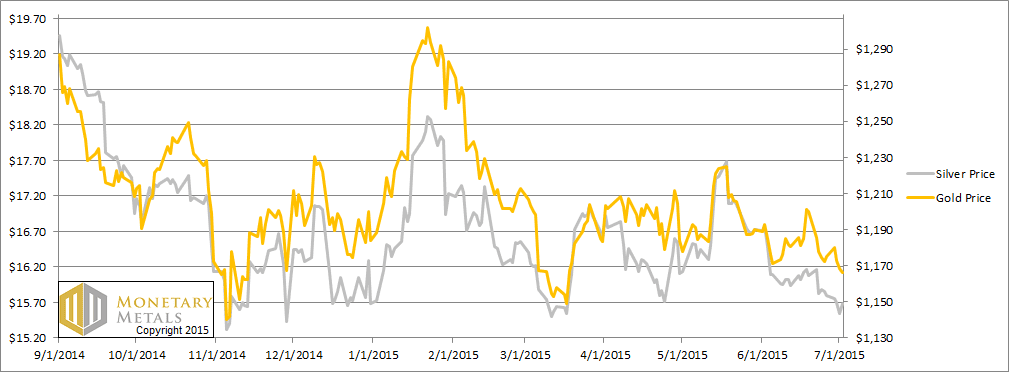
First, here is the graph of the metals’ prices.
The Prices of Gold and Silver
We are interested in the changing equilibrium created when some market participants are accumulating hoards and others are dishoarding. Of course, what makes it exciting is that speculators can (temporarily) exaggerate or fight against the trend. The speculators are often acting on rumors, technical analysis, or partial data about flows into or out of one corner of the market. That kind of information can’t tell them whether the globe, on net, is hoarding or dishoarding.
One could point out that gold does not, on net, go into or out of anything. Yes, that is true. But it can come out of hoards and into carry trades. That is what we study. The gold basis tells us about this dynamic.
Conventional techniques for analyzing supply and demand are inapplicable to gold and silver, because the monetary metals have such high inventories. In normal commodities, inventories divided by annual production (stocks to flows) can be measured in months. The world just does not keep much inventory in wheat or oil.
With gold and silver, stocks to flows is measured in decades. Every ounce of those massive stockpiles is potential supply. Everyone on the planet is potential demand. At the right price, and under the right conditions. Looking at incremental changes in mine output or electronic manufacturing is not helpful to predict the future prices of the metals. For an introduction and guide to our concepts and theory, click here.
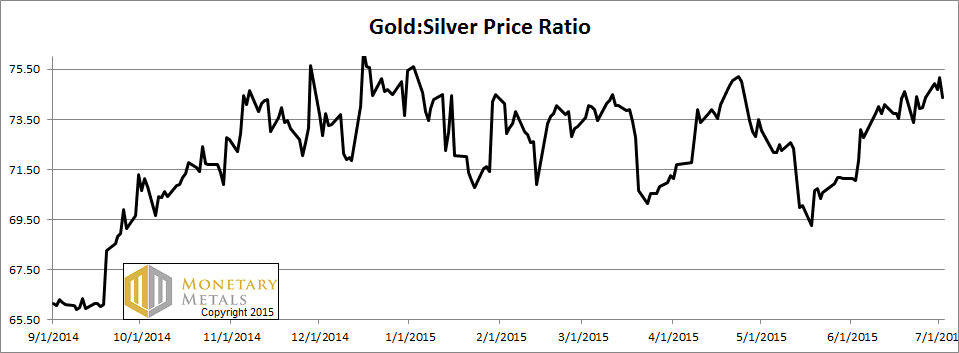
Next, this is a graph of the gold price measured in silver, otherwise known as the gold to silver ratio. It ended unchanged this week.
The Ratio of the Gold Price to the Silver Price
For each metal, we will look at a graph of the basis and cobasis overlaid with the price of the dollar in terms of the respective metal. It will make it easier to provide brief commentary. The dollar will be represented in green, the basis in blue and cobasis in red.
Here is the gold graph.
The Gold Basis and Cobasis and the Dollar Price
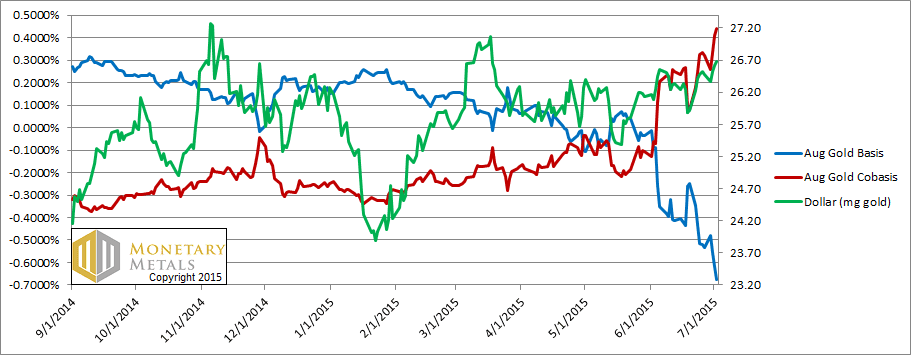
The dollar rose (i.e. the price of gold, measured in dollars, fell). Scarcity (i.e. the cobasis, the red line) rose with the move. This is the pattern that repeats time and again. When speculators buy futures contracts, the price of the dollar falls and the scarcity of gold falls with it. This week, speculators sold gold, driving up the price of the dollar (to 26.67mg) and the scarcity of gold rose as well.
The fundamental price of gold did not change at all. It’s still 30 bucks over the market price.
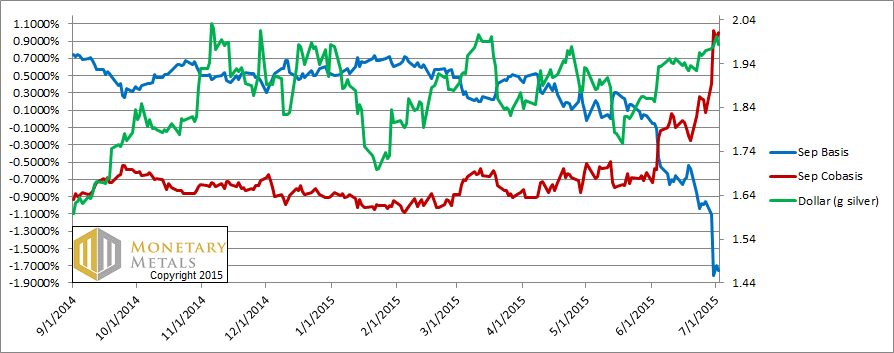
Now let’s look at silver.
The Silver Basis and Cobasis and the Dollar Price
Last week, we said:
“The fundamental price of silver rose a nickel this week. It’s $17.39. [thanks to a reader who caught the typo—the correct number was $15.39.]”
And the price this week dipped several times to about $15.46. That is pretty darned close, and closer than it had gotten in years.
In the big picture, the price did not move much on the week. However, look at that red cobasis line go. It was a mere 7 basis points last Friday. It ended this week at 100 bps. The cobasis of farther-out contracts also rose proportionally.
Suddenly, the silver market is firm.
Think like an arbitrager for a minute. It’s possible to earn 1% annualized, on a simple trade with no risk (as conventionally understood). Just sell a bar of silver and buy a contract for September delivery—called decarrying the metal. The trade matures in no more than 3 months, and you end where you started (plus the free 1% profit). Show us any other investment that pays so much for so little duration, and it will have “risk” written all over it.
And yet, that trade is now offered in silver.
We can name two reasons why the cobasis might skyrocket. One is that there is a risk. If your counterparty defaults, then you don’t get your metal back. You may get dollars. The exchange will insist the dollars are equivalent to the metal, but that’s small consolation.
We do not believe this is the main problem now, because it’s not occurring in gold. If the banks were in imminent danger, the gold basis would not be quiescent.
The other possible reason is that there’s a growing shortage of silver. Of course, in order to decarry silver, you have to have the metal. If it’s not available, you can just wistfully watch the rising cobasis.
So now, for the first time in about two years, the fundamental price of silver is above the market price, about $0.35 over.
We’re reminded of a dancing bear. It’s not a particular good dancer. What’s interesting is that it’s a bear. And it’s dancing. This is not a particularly big fundamental price premium over market. What’s interesting is that the fundamental price of silver is above the market.
Unless you really like to trade the bleeding edge of a signal change, you may not want to jump in here. Silver’s newfound scarcity could disappear as rapidly as it appeared. And even if it’s stable, it does not mean that the fundamental price must necessarily skyrocket.
We would recommend waiting to see what the markets bring us, not to mention the near-term fallout from Greece this week.
Keith is speaking at FreedomFest this week in Las Vegas.
© 2015 Monetary Metals
http://www.zerohedge.com/news/2015-07-04/why-did-citigroups-precious-metals-derivative-exposure-just-soar-1260
Question? How is the fundamental price derived?
Keith,
Cycle research from different sources says the monetary metal market is about to breakout. With silver’s red cobasis line being firm, it may be best to get in now because, as they say, “If you want to be on time, you need to be early.”
Carl
Anything new regarding the silver basis and cobasis : silver comex prices is being destroyed currently.