Silver OMG, Report 3 July, 2016
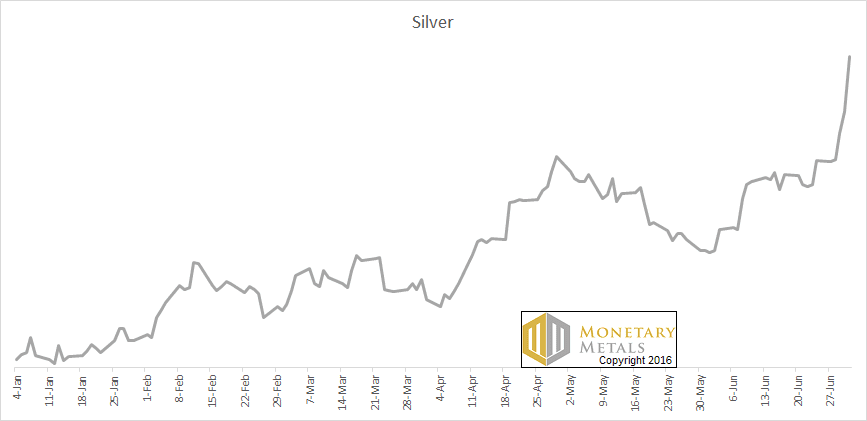
On Wednesday through Friday, the price of silver spiked massively. It ended the week about $2 higher than the previous week. The last time we recall silver price action like this was about 3 years ago, in August 2013. That one week, the price rose about $2.50. Before that was a week in August 2012, with a price gain of about $2.70. Previously, January 2012, +$2.50. Earlier was Oct 2011, +$4. The biggest was in April 2011, +$4.20.
Looking beyond this week, the whole of year 2016 looks like a parabola to us.
Silver Price Parabola, 2016 YTD
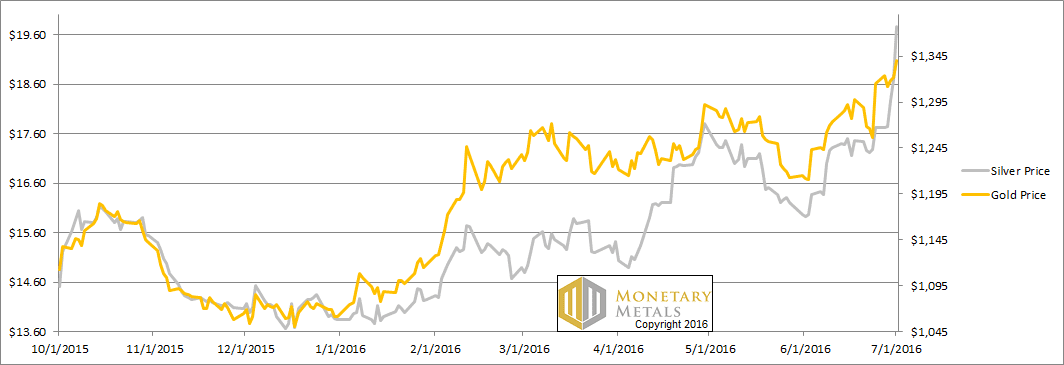
The price of gold moved up, but it was not unusual at all. +$26.
Especially in the context of the British referendum to leave the EU, it is easy to project onto others one’s own distrust of profligate governments, massive public debts, an opaque banking system, and central banks who are desperately and visibly trying to debase their currencies.
However, we would suggest taking a step back and looking at this more calmly. The price moved up. If we set aside the natural tendency towards recency bias, this price move is not so exceptional. Indeed, we have several examples of moves this large or greater. None of those presaged the End of the Monetary World as We Know It. Actually, they presaged further price declines.
We have seen headlines on Friday about the “goldwagon to $10,000”, “$360 silver”, and other hyperbolic assertions. It’s never good for your wealth to go into the casino to place your bets based on this kind of information.
Let’s look at the only the only true picture of the supply and demand fundamentals for silver, and of course gold too. But first, here’s the graph of the metals’ prices.
The Prices of Gold and Silver
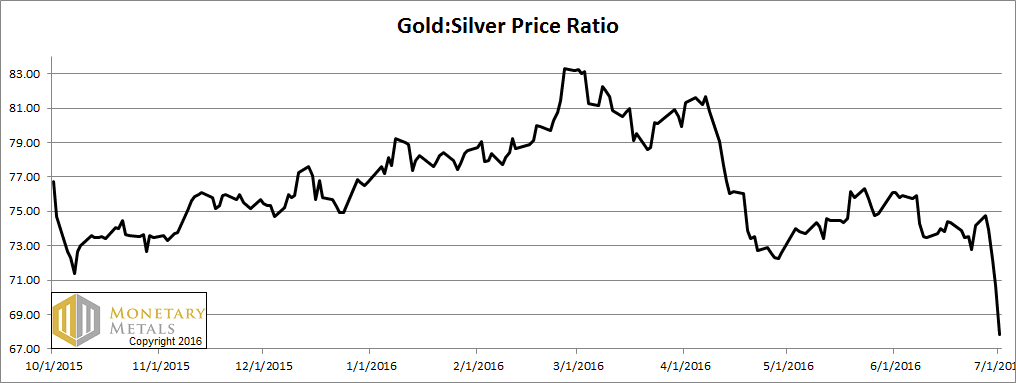
Next, this is a graph of the gold price measured in silver, otherwise known as the gold to silver ratio. The ratio had a mini-collapse this week.
The Ratio of the Gold Price to the Silver Price
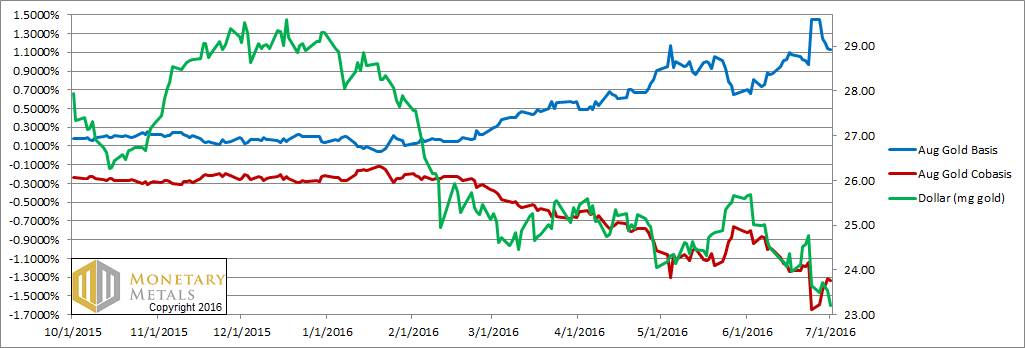
For each metal, we will look at a graph of the basis and cobasis overlaid with the price of the dollar in terms of the respective metal. It will make it easier to provide brief commentary. The dollar will be represented in green, the basis in blue and cobasis in red.
Here is the gold graph.
The Gold Basis and Cobasis and the Dollar Price
Look at that. The price of the dollar dropped (i.e. the price of gold, measured in dollars, rose) almost half a milligram. At the same time, the abundance of gold (i.e. the basis, the blue line) fell from 1.4% to 1.1%. 1.1% is still a high yield for a two month carry trade. But it’s less than it was.
Other months did not move so greatly. What could cause the basis of the near month to fall as it nears First Notice Day, the deadline for speculators without the cash to stand for delivery to exit the contract? These speculators, every one of them, must sell. There is downward pressure on the August gold contract, and upward pressure on the October gold contract.
It’s no surprise that our calculated fundamental price of gold is up. But not that much, $50. The market price is up $26, so it’s still far above the fundamentals. But this week, about $205.
Now let’s turn to silver.
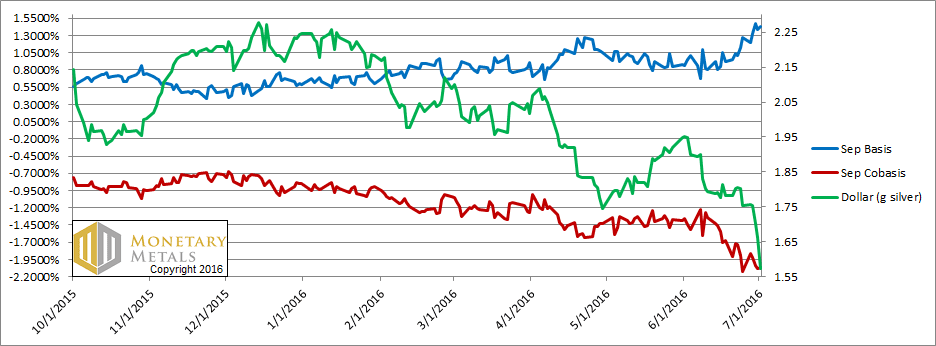
The Silver Basis and Cobasis and the Dollar Price
In silver, as the price of the dollar rose / dollar price of silver, the abundance rose.
The fundamental price is up, about $1.35. However, the market price gained about $2, increasing the fundamental-market spread another 65 cents, to just under $3.
© 2016 Monetary Metals


Not surprisingly I expected a report like this.
As a side note…I sold my entire holding of silver bars the day before Bin Laden was reportedly shot to death and then thrown out of a plane???? who believes that???
I mean If the USA had his body would they not bring him back to USA for all to see?
That day was the end of the parabola of silver price.
It was also the end of truthful journalism in the USA…sadly.
Good work again Keith.
If Keith refers to SRS Rocco and Jim sinclair rants (whatever the reasons given), it has been the same for years now, whatever gold was at 1800, 1400 or 1050.
However that is very convenient to have them in order to be able to appear like reasonnable monetary scientist opposed with the unreasonnable cheerladers !
By the way I am surprised to see that fundamentals prices especially the silver one has been rising this past week (even if well below the spot values)…
I forgot another clown ie ego von greyez whith another 5 digits target for gold even if no timing is given !
Hi Keith,
Another interesting week!
How long have you been publishing your ‘fundamental’ for gold and silver? Would you be able to produce a pair of charts (for each of gold & silver) comparing the market price v the fundamental for all the time you’ve been calculating the fundamentals?
I’m particularly interested in seeing what direction the fundamental was indicating around the time of the all time highs of about $50 silver and $1900 gold in 2011.
If you are able to devote some time to this, thanks.
Hi Keith, Compared to COMEX, do you know if there is any significant difference in the basis & cobasis numbers on the Shanghai Futures Exchange.
A chart showing how inaccurate the fundamental price has been? Never going to happen. All you’ll get here is bearish commentary when prices are above fundamental and bullish commentary when the price is below fundamental.
Just take a look a each week’s title the last Several weeks.
I noted in the past that bullish report(s ?) are quite always very moderately bullish while the bearish reports are always very bearish but with always a disclaimer with something like : “but we cannot be sure as central banks could make another folly which would increase speculators bullish bets”.
Yep. Amazing how a purportedly pro-gold website can be so slanted to the bearish side… despite all sorts of other evidence.
Take, for example, the two months of article titles:
7/3 — Silver OMG!
6/29 — This move higher is a “Frenzy”
6/19 — “Soft and Softer Fundamentals”
6/12 — “Where then will silver then go” (i.e., once the speculators sell)
6/5 — “The (high) cost of bullish bets”
5/29 — “Gold and silver aren’t getting any stronger”
5/22 — “Revenge of the fundamentals” (a little early, arn’t we?)
5/15 — “Gold demand falling” (according to the carry trade perhaps… but these are called “futures” for a reason)
While I agree prices seem to be getting dangerously heated the last couple days (unless someone is on the wrong side of silver in a big way) one has to be very bearishly biased not to recognize recent strength and the billions in other investment dollars bidding up PM prices.
I agree that gold will go down again… but before making any bold statements to that effect I’d need to see prices begin to weaken. To essentially call the top every week is a form of speculation too. And a very costly one.
“And a very costly one.” – Oh, please. It’s only costly if you’ve gone short. I haven’t seen Keith advise that. His advice is always the same. 1) If you haven’t hoarded your monetary metals yet, think about starting (i.e. buying a little). 2) Never naked-short a monetary metal.
The point about the contango and positive market-to-fundamental price spreads is that *speculating* (as opposed to hoarding) long is dangerous here, as spec longs already have an outsize influence in the market and may near exhaustion soon.
The news in Keith’s update this week, *as I read it*, is the following.
– At last some hoarders have entered and driven up the fundamental prices.
– Still, spec longs retain an outsize influence and are creating froth. So,
– This move is not “the big one”. (The eventual move that we know is coming, when the world finally loses confidence in the U.S. dollar.)
If *you read it* as Keith somehow calling a top and telling people that they should be shorting this market, well good luck to you.
” It’s only costly if you’ve gone short” : some people had waited for silver to fall to 12, 10 or even 8 in order to take long term physical positions.
If silver go back to this level, great for them, if silver only go back to 18 , they willl have 25% less silver mass for the same amount of dollars, so it can be considered as costly except if silver go back to 14 or below (very possible).
By the way apart from a few perma bulls, even if most are only focus long and very long term, nearly nobody said hyperinflation in the west within 3 months which could probably lead to the final run for gold/silver.
Most even very positive like adam hamilton are warning for a correction for the next few weeks.
“some people had waited for silver to fall to 12, 10 or even 8 in order to take long term physical positions” – yes; and whose fault would that be?
Hi bbartlow,
If that was meant as a reply to my request above to Keith for a chart showing fundamental against market price, that would not be the way I would read it – even if the two values were rarely close.
The way I read Keith’s take on the fundamental is that it shows what the price ‘ought’ to be in the absence of certain types of market activity (e.g. ‘paper’ speculation or, perhaps, even all paper trading).
Depending, then, upon the relative size of the forcing effect of the various competing forcing functions (fundamental, speculative paper trading, scarcity and/or abundance, etc.) it may be possible to use them either singly or in combination as a predictor of likely future trend.
My interest, therefore, is to see if the fundamental might lead (or possibly lag) the market price and, if so, on what scale/granularity. That’s why I’m particularly interested in the 2011 highs – but equally, I’d be interested in the lows. It’s just that the lows (in 2009 and 2015 for example) are not so big and obvious as the 2011 highs – especially the 2009 gold low.
@ bbartlow = To be fair, internal consistency demands much of that. As to whether Keith will produce such a chart, let’s wait an see. Even so, determining whether his fundamental chart is wrong, or the market irrational, may not be so simple. What’s that adage about markets staying irrational longer than one can stay solvent … ?
I agree, although a number of people have already asked for such a track record or documentation many times. (You can check just my own comments/questions over the last few months) This is not intended to prove the so-called fundamental price inaccurate but to see how much variation (to actual price) there’s been over time. I’m sure there’s some value to understanding carry trades… but how useful is it, that’s the question.
In 2011, for example, the PM’s ran hard to a spectacular top. To what extent that move was captured by a study of carry trade dynamics would be informative. Or it might actually be embarrassing… which is perhaps why the raw data has never been presented in a scientific way.
Frankly we don’t know… but the silence on this issue is very suspect.
Yes, it would be very interesting, and probably instructive, to see such a chart.
I have followed these reports on and off over the past few years, and noticed on a fair few occasions that market moves tended to switch in the direction of the fundamental price, up or down, where Keith determined it to be. But one would need to do some rigorous work to determine the extent to which knowledge of the FP could be made useful.
If the fundamental for gold at week-end was around $1140 (1344 minus 205), and for silver around $16.90 (= 19.85 minus 2.95), then the fundamental GSR is around 67.45? Which would suggest that GSR was fairly valued at the end of last week.
If I understand it right, Keith purports no correlation between spot price and fundamental price. A chart of the requested information would have no bearing on the usefulness of these reports.
The question is how’d you get silver so wrong?
You could say how did the traders in the east get it so wrong buying at $21.
It just comes down to the time frame in which people are operating, many of whom are short term.
Is it better to see the big picture or to be glued to the 1 minute charts?
Monetary Metals planning something big? Looks like a rough draft promotional material from a marketing agency.
https://www.youtube.com/watch?v=KEKR7eQkM6w
By the way, they spelled yield as “yeild“ at 2:30.
Looks interesting though.
Speculator or hoarder or warehouse person? Is the difference as clear as some suggest?
In my case I’m comfortable being long either CME warrants or futures, depending on the contango. My drug of choice is platinum, which I regard as the best value PM at current prices. (nearly a $300 discount to gold, close to the largest ever discount ) If the cost to roll futures forward is approximately equal to storage costs plus a small amount, then I’ll usually roll forward. I’m comfortable with a mix, and will adjust my position either way based on being well paid to hold physical metal. Am i an investor, hoarder, warehouse person, market marker, scalper … please tell me because I don’t know the answer.
I have the macro view that platinum is a somewhat better investment than domestic and international bonds (low to negative interest plus duration risk) or cash, and diversification from an all equities portfolio. I’m not wedded to platinum, simply believe it’s currently a better risk versus reward and diversification asset.
Is my investment and trading style unique or rare? I very much doubt that. It may be common, making these categories of market actors quite blurry.
When the green and red lines track it is speculation driven price action. When they diverge the move is fundamental.
Fundamentals up for this week, or strictly attributed to the “contract roll”?
First notice day for Aug ’16 future is July 29, 2016
Week Ended July 8, 2016
Spot Gold: Bid: 1366.07 Ask: 1366.58
Jul 08, 2016 17:00:00 EST source: Goldseek
Aug ’16 Future Bid: 1367.30 Ask: 1367.40
Jul 08, 2016 16:59:58 EST source: esignal
Carry: $0.72
Basis: 0.316%
De-Carry: $-1.33
Cobasis: -0.584%
Dollar at 22.77mg of gold
That data above will move around a bit depending on your data source. Weekly close as per:
1) 1365.91 – goldprice.org
2) 1365.85 – 24hgold.com
3) 1366.07 – Goldseek
4) 1366.33 – Bloomberg (XAUUSD Spot Exchange Rate)
Are you trying to put us out of a job? :)