
Silver Speculators Gone Wild, Report 29 Jan, 2017
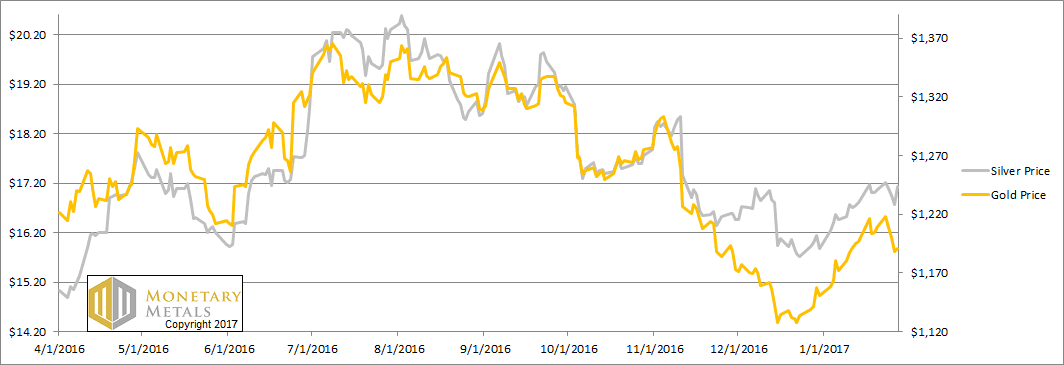
This week, the prices of the metals had been up Sunday night but were slowly sliding all week—until Friday at 7:00am Arizona time (14:00 in London). Then the price of silver took off like a silver-speculator-fueled-rocket. It went from $16.68 to $17.25, or 3.4% in two hours.
What does it mean? We don’t know. We would bet an ounce of fine gold against a soggy dollar bill that no one else does either. The old stories of silver shortage or manipulation have no power to explain this move. Why not? Because they are old. The explanation would have to say that earlier in the day there was a reason for silver to trade well under $17 but as of that moment, it was urgent that the metal trader well over $17.
As often occurs, once the move hits certain levels on a price or momentum chart, that’s all it takes. It’s of no use to say that in the long run this will be just another blip of noise. In the heat of the moment, these 60-cent moves are exciting.
Below, we will have an intraday silver chart that shows clearly something that is almost never available to the public. We have a plot of the basis against price. If other theories are right (e.g. manipulation, shortage) this chart should show nothing of interest.
We are at no risk of that. :)
But first, the price action and regular basis charts.
The Prices of Gold and Silver
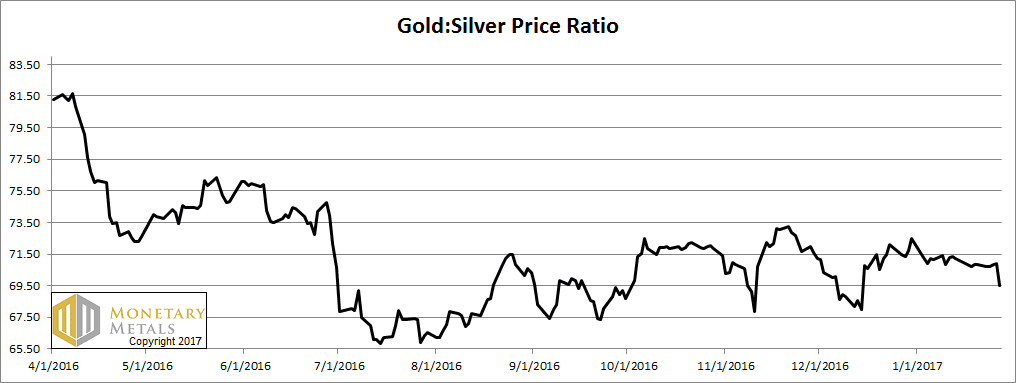
Next, this is a graph of the gold price measured in silver, otherwise known as the gold to silver ratio. It fell this week.
The Ratio of the Gold Price to the Silver Price
For each metal, we will look at a graph of the basis and cobasis overlaid with the price of the dollar in terms of the respective metal. It will make it easier to provide brief commentary. The dollar will be represented in green, the basis in blue and cobasis in red.
Here is the gold graph.
The Gold Basis and Cobasis and the Dollar Price
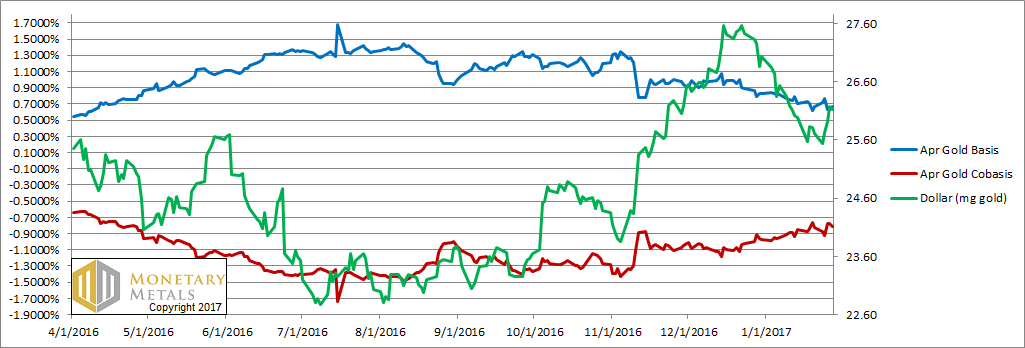
The pattern of the past few weeks did not continue. This week, when the price of gold went down, the cobasis (scarcity) went down on some days. When the price went up, the cobasis went down.
Our calculated fundamental price fell $32 to just about $100 over the market price.
Now let’s look at silver.
The Silver Basis and Cobasis and the Dollar Price
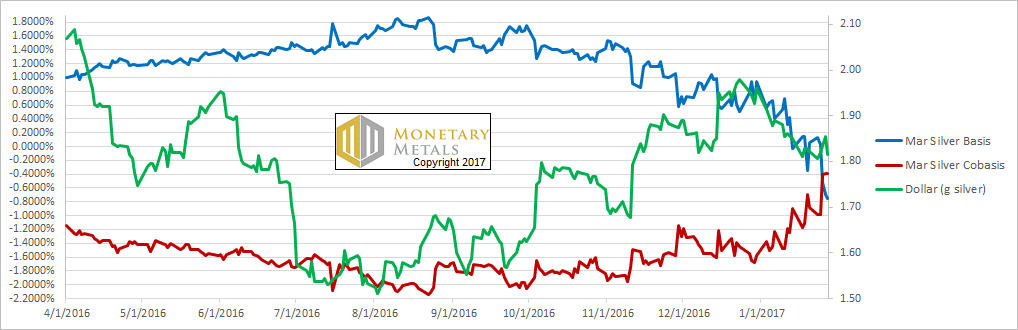
In silver, scarcity increased a bit on Wednesday and stayed there through Friday (for our normal daily reading, but see below).
Our calculated fundamental price moved up 20 cents from last week. It had been higher, but actually fell a bit on Thursday and Friday. It is now a dime or two above the market.
Below is the chart we promised at the top of the Report.
Intraday Friday Silver Basis Silver Price
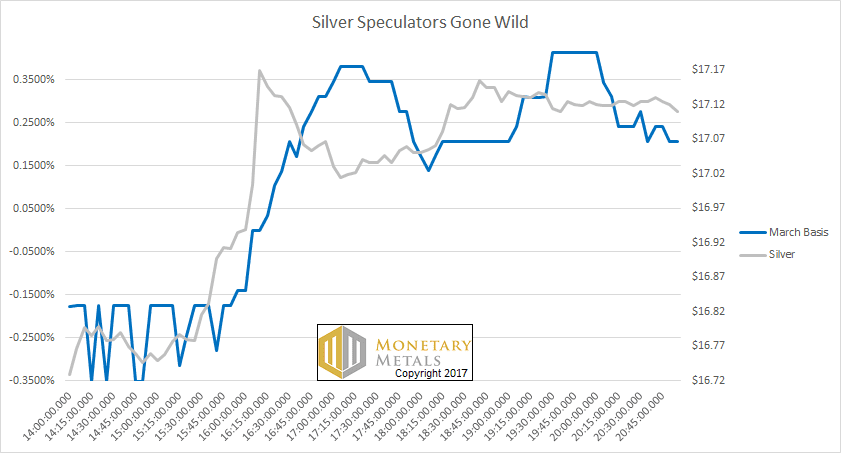
(times are GMT)
As the price rises about 40 cents, the basis rises about 60bps from around -0.25% to +0.35%.
To understand this, picture a spread between the price of silver in the spot market—a bar—and silver in the futures market—a contract for March delivery of a bar. When the market is quiescent, this spread is consistent. If there buying pressure in spot, then the spread will compress. If there is buying pressure in futures, then the spread will widen (or if it is negative like Friday morning, it can go positive).
On Friday, this spread widened about ¾ of a cent. This may not seem like much, but the market makers are fighting it all the way. They make money by buying spot and selling futures, called carrying silver. Carrying tends to compress the spread. Despite the market makers, the speculators forced this spread wider by nearly a cent.
Spread is much more stable than price. This move is a big deal.
© 2016 Monetary Metals

Leave a Reply
Want to join the discussion?Feel free to contribute!