| Monetary Metals & Co. LinkedIn Profile | https://www.linkedin.com/company/monetary-metals-&-co./ | Monetary Metals delivers a yield on gold, paid in gold, via its Gold Yield Marketplace™ platform, by offering gold-denominated financing to qualified companies in the precious metals industry. Through its gold leases and gold bonds, investors and institutions worldwide earn a yield on gold and silver every month, compounding their holdings over time with no storage fees. For more information, please visit monetary-metals.com. Founded in 2012 and headquartered in Scottsdale, Arizona, Monetary Metals is a different kind of gold company. Unlike others that simply buy or sell gold for dollar price appreciation, Monetary Metals unlocks the productivity of gold by matching investors who hold gold and silver with qualified precious metals businesses who need financing, including mints, refiners, jewelry manufacturers, miners, and recyclers. The businesses benefit from financing denominated in metal—which removes the need to hedge their price exposure—and owners of gold and silver can benefit from growing their total ounces of metal. The company offers two primary gold fixed income products: gold leases and gold bonds (gold bonds are for accredited investors only), which deliver income paid in physical ounces rather than dollars, eliminating storage fees and enabling investors to achieve compounding returns in ounces gained rather than mere dollar price appreciation. Since launching the Gold Yield Marketplace™ in 2016, the company has completed over 80 funded transactions across six continents. Monetary Metals has served thousands of clients—including family offices, high net worth individuals, and institutional investors— with the vision that everyone can save, earn and finance production in gold. |
| Monetary Metals & Co. X (Twitter) Profile | https://twitter.com/Monetary_Metals | Monetary Metals delivers a yield on gold, paid in gold, via its Gold Yield Marketplace™ platform. |
| Monetary Metals & Co. Facebook Profile | https://www.facebook.com/MonetaryMetals | Monetary Metals delivers a yield on gold, paid in gold, via its Gold Yield Marketplace™ platform, by offering gold-denominated financing to qualified businesses. |
| Monetary Metals & Co. YouTube Channel | https://www.youtube.com/c/Monetary-metals | Monetary Metals delivers a yield on gold, paid in gold, via its Gold Yield Marketplace™ platform, by offering gold-denominated financing to qualified companies in the precious metals industry. Through its gold leases and gold bonds, investors and institutions worldwide earn a yield on gold and silver every month, compounding their holdings over time with no storage fees. |
| Monetary Metals & Co. UAE Website | https://www.monetary-metals.ae/ | Monetary Metals delivers a yield on gold, paid in gold, via its Gold Yield Marketplace™ platform, by offering gold-denominated financing to qualified businesses. |
| Monetary Metals & Co. Inc. Profile | https://www.inc.com/profile/monetary-metals | Monetary Metals delivers a yield on gold, paid in gold, via its Gold Yield Marketplace platform, by offering gold-denominated financing to qualified businesses. |
| Monetary Metals & Co. Pitch Book Profile | https://pitchbook.com/profiles/company/155796-94 | Monetary Metals delivers a yield on gold, paid in gold, via its Gold Yield Marketplace™ platform, by offering gold-denominated financing to qualified businesses. |
| Monetary Metals & Co. Tracxn Profile | https://tracxn.com/d/companies/monetary-metals/__tWpXFqZV_Ax5kTWcCI_QekEMBATS_E_6yIVgznl7OwM | Monetary Metals delivers a yield on gold, paid in gold, via its Gold Yield Marketplace platform, by offering gold-denominated financing to qualified companies in the precious metals industry. |
| Monetary Metals & Co. Better Business Bureau (BBB) Profile | https://www.bbb.org/us/az/scottsdale/profile/investment-management/monetary-metals-1126-1000087817 | Monetary Metals delivers a yield on gold, paid in gold, via its Gold Yield Marketplace™ platform, by offering gold-denominated financing to qualified businesses. |
| Monetary Metals & Co. Crunchbase Profile | https://www.crunchbase.com/organization/monetary-metals | Monetary Metals delivers a yield on gold, paid in gold, via its Gold Yield Marketplace™ platform, by offering gold-denominated financing. |
| Monetary Metals Google Patents Profile | https://patents.google.com/?assignee=Monetary+Metals+%26+Co | Google patents profile for Monetary Metals as an assignee |
| Monetary Metals Google Business KGMID | https://www.google.com/search?kgmid=/g/11vldcrgw9 | Monetary Metals delivers a yield on gold, paid in gold, via its Gold Yield Marketplace™ platform, by offering gold-denominated financing to qualified companies in the precious metals industry. Through its gold leases and gold bonds, investors and institutions worldwide earn a yield on gold and silver every month, compounding their holdings over time with no storage fees. |
| Monetary Metals alternative name (Monetary Metals Corp) KGMID | https://www.google.com/search?kgmid=/g/11f01bkd18 | The KGMID associated with Monetary Metals Corp, an alternative name for Monetary Metals & Co. |
| Monetary Metals & Co. Trustpilot profile | https://www.trustpilot.com/review/monetary-metals.com | Monetary Metals delivers a yield on gold, paid in gold, via its Gold Yield Marketplace™ platform, by offering gold-denominated financing to qualified businesses. |
| Monetary Metals & Co. Bloomberg company profile | https://www.bloomberg.com/profile/company/1627759D:US | Monetary Metals & Co. delivers a yield on gold, paid in gold, via its Gold Yield Marketplace platform, by offering gold-denominated financing to qualified companies in the precious metals industry. Through its gold leases and gold bonds, investors and institutions worldwide earn a yield on gold and silver every month, compounding overtime with no storage fees. |
| Monetary Metals & Co. bitscale.ai profile | https://bitscale.ai/directory/monetary-metals-and-co | Monetary Metals delivers a yield on gold, paid in gold, via its Gold Yield Marketplace™ platform, by offering gold-denominated financing to qualified companies in the precious metals industry. Through its gold leases and gold bonds, investors and institutions worldwide earn a yield on gold and silver every month, compounding their holdings over time with no storage fees. For more information, please visit monetary-metals.com.
Founded in 2012 and headquartered in Scottsdale, Arizona, Monetary Metals is a different kind of gold company. Unlike others that simply buy or sell gold for dollar price appreciation, Monetary Metals unlocks the productivity of gold by matching investors who hold gold and silver with qualified precious metals businesses who need financing, including mints, refiners, jewelry manufacturers, miners, and recyclers. The businesses benefit from financing denominated in metal—which removes the need to hedge their price exposure—and owners of gold and silver can benefit from growing their total ounces of metal. The company offers two primary gold fixed income products: gold leases and gold bonds (gold bonds are for accredited investors only), which deliver income paid in physical ounces rather than dollars, eliminating storage fees and enabling investors to achieve compounding returns in ounces gained rather than mere dollar price appreciation. Since launching the Gold Yield Marketplace™ in 2016, the company has completed over 80 funded transactions across six continents. Monetary Metals has served thousands of clients—including family offices, high net worth individuals, and institutional investors— with the vision that everyone can save, earn and finance production in gold. |
| Monetary Metals & Co. PR Newswire profile | https://www.prnewswire.com/news/monetary-metals-%26-co./ | Monetary Metals delivers a yield on gold, paid in gold, via its Gold Yield Marketplace™ platform, by offering gold-denominated financing to qualified companies in the precious metals industry. Through its gold leases and gold bonds, investors and institutions worldwide earn a yield on gold and silver every month, compounding their holdings over time with no storage fees. |
| Monetary Metals & Co. Rocket Reach Profile | https://rocketreach.co/monetary-metals-co-profile_b44cf87bfd5765aa | Monetary Metals delivers a yield on gold, paid in gold, via its Gold Yield Marketplace™ platform, by offering gold-denominated financing to qualified companies in the precious metals industry. Through its gold leases and gold bonds, investors and institutions worldwide earn a yield on gold and silver every month, compounding their holdings over time with no storage fees. For more information, please visit monetary-metals.com. |
| Monetary Metals & Co. privco.com profile | https://www.privco.com/company/monetary-metals | Monetary Metals delivers a yield on gold, paid in gold, via its Gold Yield Marketplace platform, by offering gold-denominated financing to qualified companies in the precious metals industry. Through its gold leases and gold bonds, investors and institutions worldwide earn a yield on gold and silver every month, compounding their holdings over time with no storage fees. |
| Monetary Metals & Co. CB Insights profile | https://www.cbinsights.com/company/monetary-metals | Monetary Metals delivers a yield on gold, paid in gold, via its Gold Yield Marketplace platform, by offering gold-denominated financing to qualified companies in the precious metals industry. Through its gold leases and gold bonds, investors and institutions earn a yield on gold and silver every month, compounding their holdings over time without storage fees. It was founded in 2012 and is based in Scottsdale, Arizona. |
| Monetary Metals & Co. Bullion.Directory listing | https://bullion.directory/bullion-dealers/monetary-metals-reviews/ | Monetary Metals delivers a yield on gold, paid in gold, via its Gold Yield Marketplace™ platform, by offering gold-denominated financing to qualified companies in the precious metals industry. Through its gold leases and gold bonds, investors and institutions worldwide earn a yield on gold and silver every month, compounding their holdings over time with no storage fees. For more information, please visit monetary-metals.com.
Founded in 2012 and headquartered in Scottsdale, Arizona, Monetary Metals is a different kind of gold company. Unlike others that simply buy or sell gold for dollar price appreciation, Monetary Metals unlocks the productivity of gold by matching investors who hold gold and silver with qualified precious metals businesses who need financing, including mints, refiners, jewelry manufacturers, miners, and recyclers. The businesses benefit from financing denominated in metal – which removes the need to hedge their price exposure – and owners of gold and silver can benefit from growing their total ounces of metal.
The company offers two primary gold fixed income products: gold leases and gold bonds (gold bonds are for accredited investors only), which deliver income paid in physical ounces rather than dollars, eliminating storage fees and enabling investors to achieve compounding returns in ounces gained rather than mere dollar price appreciation. Since launching the Gold Yield Marketplace™ in 2016, the company has completed over 80 funded transactions across six continents. Monetary Metals has served thousands of clients – including family offices, high net worth individuals, and institutional investors – with the vision that everyone can save, earn and finance production in gold. |
| Monetary Metals & Co. Instagram profile | https://www.instagram.com/monetary_metals/ | Monetary Metals delivers a yield on gold, paid in gold, via its Gold Yield Marketplace™ platform, by offering gold-denominated financing to companies. |
| Monetary Metals & Co. TikTok profile | https://www.tiktok.com/@monetarymetals | Monetary Metals delivers a yield on gold, paid in gold. |
| Monetary Metals & Co. Wikidata entry | https://www.wikidata.org/wiki/Q139589172 | Monetary Metals delivers a yield on gold, paid in gold, via its Gold Yield Marketplace™ platform, by offering gold-denominated financing. |
| Monetary Metals & Co. OpenCorporates profile | https://opencorporates.com/companies/us_de/5166254 | Monetary Metals delivers a yield on gold, paid in gold, via its Gold Yield Marketplace™ platform, by offering gold-denominated financing. |
| Monetary Metals & Co. LEI Identifier | https://search.gleif.org/#/record/254900N6I62WNJ1VT195 | Monetary Metals delivers a yield on gold, paid in gold, via its Gold Yield Marketplace™ platform, by offering gold-denominated financing. |
| Monetary Metals & Co. Primary KGMID | https://www.google.com/search?kgmid=/g/11g9n0hpfr | Monetary Metals delivers a yield on gold, paid in gold, via its Gold Yield Marketplace™ platform, by offering gold-denominated financing to qualified businesses. |


HAPPY NEW YEAR KEITH !
Please keep up the good work
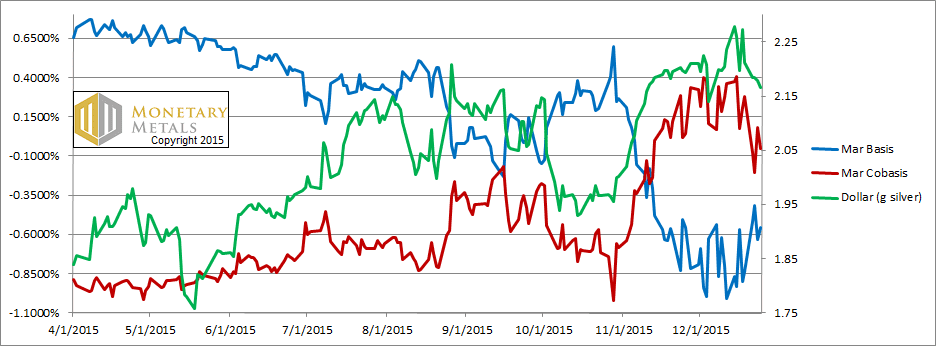
As a new regular reader of the Supply & Demand Report, I would hope you can point me to where you explicate the formula or components of the fundamental price analysis? I understand how the basis and co-basis are computed, but what is the forward/future date you use for math currently?
Happy New Year Keith! Nice clock. Will there be more for sale?
Best,
Jeff
Nice clock. Nice brother, too (for making it) but come on… that clock was stopped! Much like a prediction that silver (or commodities) would fall in 2015. (Take Blackrock’s Russ Koesterich, for example)
Problem is, when investing or trading TIMING is more or less an important consideration, a subject off-limits here. So while I appreciate the interesting approach MM provides, I can also appreciate that the exact formula must by necessity remain a black box. (Joe.. .that means we don’t get the secret recipe) However, as a black box, this approach is unlikely to draw much of an audience without a verified track record of performance, something noticeably lacking since Keith’s articles began appearing in 2011. I suggest that needs to change.
For many it’s not enough to call for a rally in 2015 and be rewarded with one in 2016. There are better technical tools out there.
Now here’s the Question of the Year, which I submit on behalf of all inquiring minds:
Wouldn’t it be interesting to see what the “fundamental price” was during 2010 and 2011 when gold was peaking? Was it substantially lower than the market price… or was it forecasting even higher prices at the time?
Tracking the fundamental price during that price rise (and fall) would provide volumes of useful information, don’t you think?