
The Federal Reserve Report, 4 September, 2016
Why is this issue of the Report entitled the Federal Reserve Report? We chose this headline because the Fed is apparently now the driver of supply and demand of gold and silver. Or at least it’s what speculators in gold and silver expect will drive the decisions of the hoarders, whom the speculators are trying to front-run.
Economist John Maynard Keynes, in a rare episode of getting something right, described a hypothetical beauty contest held by a newspaper as an analogy for speculating in the stock market. The paper publishes a hundred pictures, and to enter to you vote for the 6 which are the most attractive. Whoever picks the most popular wins a prize.
“It is not a case of choosing those [faces] that, to the best of one’s judgment, are really the prettiest, nor even those that average opinion genuinely thinks the prettiest. We have reached the third degree where we devote our intelligences to anticipating what average opinion expects the average opinion to be. And there are some, I believe, who practice the fourth, fifth and higher degrees.” (Keynes, General Theory of Employment, Interest and Money, 1936).
On Friday, the Bureau of Labor Statistics released its jobs report. 151,000 jobs were added in August. This was very disappointing. So naturally, speculators furiously bid up everything from stocks to junk bonds to gold and silver.
Wait. Bid up? Naturally?!
Yes. If the economy is slowing, then the average person expects the Fed to backpedal from its promise to raise interest rates. And if rates aren’t going up, then the quantity of money will expand. And the average person expects the prices of assets to go up with the quantity of money.
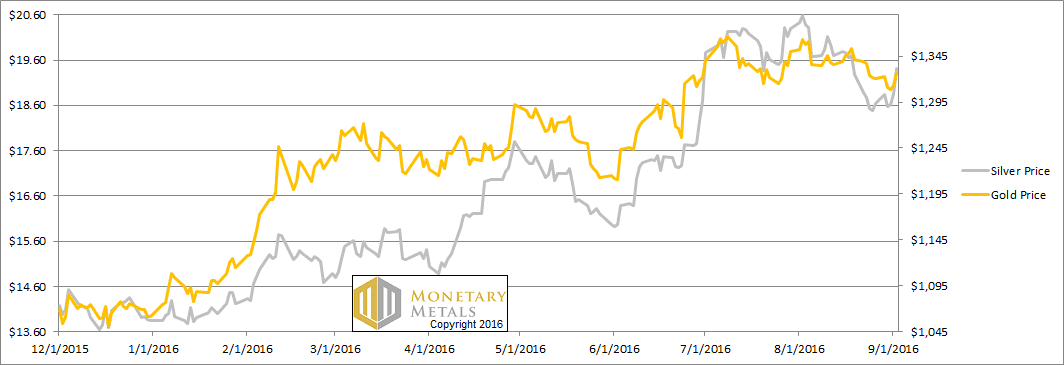
The price of silver went up about 3%.
Of course these labor announcements have no long-term impact on the price of anything, which is driven by supply and demand fundamentals. Which is why we publish the only true picture of the fundamentals of the monetary metals. But first, here’s the graph of the metals’ prices.
The Prices of Gold and Silver
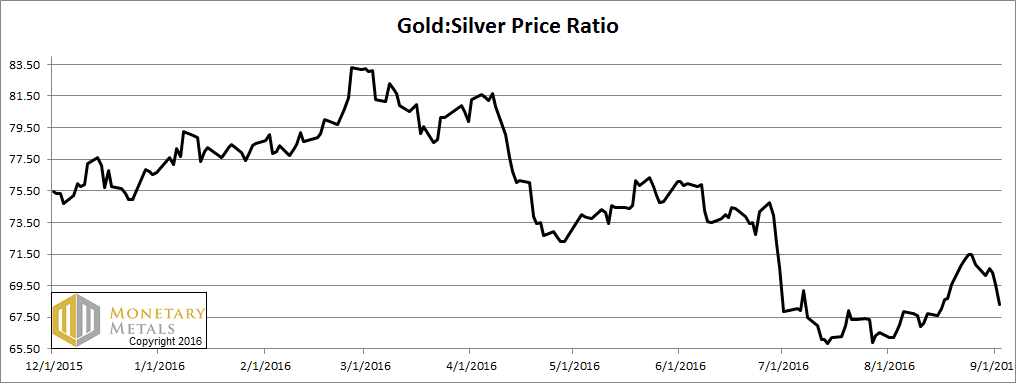
Next, this is a graph of the gold price measured in silver, otherwise known as the gold to silver ratio. It fell 2.5 points this week. Apparently the average person expects that the average person will interpret the Fed’s policy to impact the price of silver more than the price of gold.
The Ratio of the Gold Price to the Silver Price
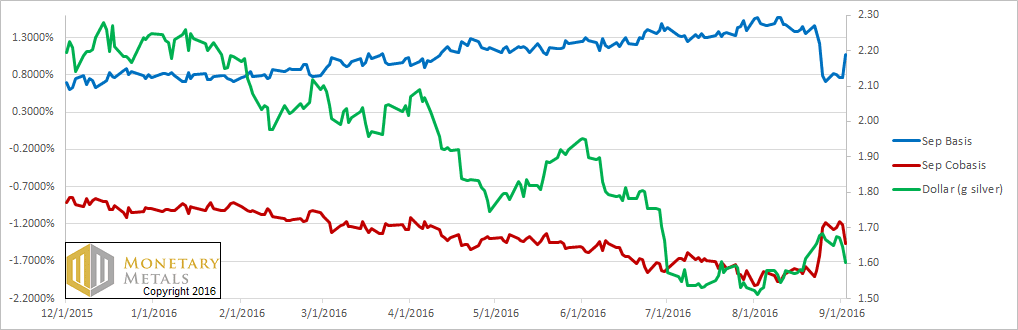
For each metal, we will look at a graph of the basis and cobasis overlaid with the price of the dollar in terms of the respective metal. It will make it easier to provide brief commentary. The dollar will be represented in green, the basis in blue and cobasis in red.
Here is the gold graph.
The Gold Basis and Cobasis and the Dollar Price

The price of gold didn’t even move that much, up only $6. Yet we see a reversal of the trend of rising scarcity (red line, cobasis) and falling abundance (blue line, basis). No more backwardation in the October contract, despite the relentless selling pressure as traders have to roll their positions.
Our calculated fundamental price fell, and is now about $10 over the market price.
The Silver Basis and Cobasis and the Dollar Price
In silver, the price move was much more dramatic. See the drop in the green line, which is the price of the dollar measured in silver ounces. The buck fell from 1.67 grams of silver to 1.60.
With that, we see a big drop in the scarcity (i.e. cobasis, the red line) and corresponding rise in the abundance (i.e. basis, the blue line).
Our calculated fundamental fell about 15 cents. It’s way below the market price. Perhaps the average hoarder will increase his buying of silver, for reasons that have nothing to do with the jobs report, the Fed’s likely policy responses to the jobs report, or their expectations of the average speculator’s expectations of the average speculator’s expectations.
If not, then at some point those expectations are going to come down.
© 2016 Monetary Metals
Well Keith, as always I look forward to the Monday night read of your report.
The word ‘gobbledygook’ came to mind but then I realised you weren’t talking nonsense.
Unlike most who somehow think that they are going to make a fortune in some paper promise .
Some want Gold to go to $50,000 to take a profit (?) without realising that the next step up could be ‘no offer’
Then there will be serious problems and that’s not nonsense.
Thank you for the update Keith.
It’s very interesting the silver ‘price’ moved up about 80 cents while your calculated fundamental fell about 15 cents. With the gap from 22 August now filled, the ‘upward pull’ has gone.
With gold holding $1300, it now appears that September will yield a cycle high instead of a culmination of the pullback. In other words, new highs for the move are very much in the cards. THEN we’ll get a lengthy pullback into year end.
Week ended September 9:
October Gold cobasis near the 0.432% annualized rate, dollar at 23.42mg of gold. 47 days until expiration.
Dec`16 Gold Cobasis = – 0.942%
Feb`17 Gold Cobasis = – 1.080%
If selling in the October contract depresses the bid, and therefore distorts the picture, doesn`t buying in the December increase the ask and also distort the picture?
Also, in the past you have mentioned comparing the basis/cobsis % number to LIBOR. LIBOR has been spiking the past few months with the 3 month rate now at 0.85222% from 0.32400 % a year ago. Does the ratio of the basis to LIBOR have any effect on the calculated fundamental price of the metals?