What Really Happened When Gold Crashed, Monday June 26?
Let’s establish three facts up front. One, the volume of contracts traded was not “millions” (as at least one conspiracy theorist is claiming). During the 1-minute window when the price of gold dropped from $1,254.10 to a low of $1,236.50 and recovered to $1,247, 18,031 August gold contracts traded. There was negligible volume in the October and December contracts.
Two, the Earth is round. This did not occur while “everyone” was sleeping (as at least one conspiracy theorist asserted). It happened when Europe was open and the UK had come online, at 9:01am British Summer Time (BST). China and Singapore were also open for business at that time.
Three, there was no single large futures trade that “smashed” the price but a large number of smaller trades, with the largest trade being 296 contracts (close to 1 ton or $36 million). The chart below shows milliseconds (1/1000th of a second) from 9:01:00 to 9:01:30 – 30 seconds.
At this timescale a lot of the trading is computer to computer, a fight between algorithms. We say fight, because the trading wasn’t entirely one way. Some time slots show upticks in price.
So what did happen?
We do not believe that one should try to look at whether spot or futures moved first, to determine which one is the driver of a price move. The timing is very close, due to high-speed fiber optic lines connecting market makers’ servers. And errors in timing, especially of a third party observing from the outside, could be greater than the timing of the events being measured.
We have a better way to answer this question. If the price of spot is falling relative to futures, then we know there was selling of spot. If the price of futures is falling relative to spot, then we know there was selling of futures.
This spread, future price – spot price, is called the basis.
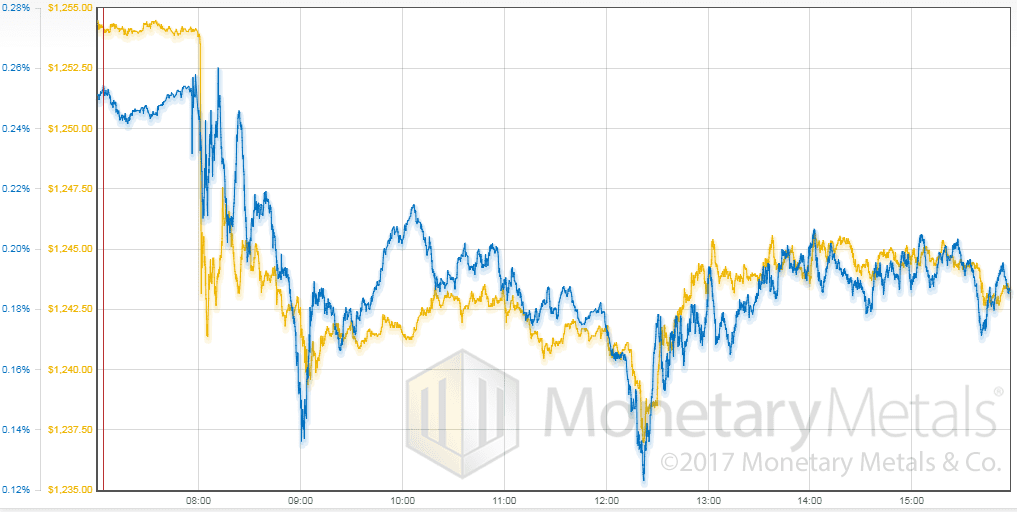
Here is a chart of the gold price overlaid with the August gold basis, showing the London trading day (times are GMT, so the chart beginning at 7am is really 8am as the UK is on daylight savings right now). The crash occurred at 8:01AM GMT, which is 9:01 BST.
We see a clear picture: as the price falls, so does the basis. This move was led by selling of futures. No, not a massive conspiracy. Indeed not massive at all.
And it should be noted that the basis did not move all that much. 10 bps. This suggests that though the move may have been driven by futures, there was plenty of selling of metal too.
Of course, if people were buying metal even holding the price constant while some nefarious party was selling futures, such that futures went down by $14, there would be nearly a $14 backwardation in the August contract. That is over 1%, or about 6% annualized.
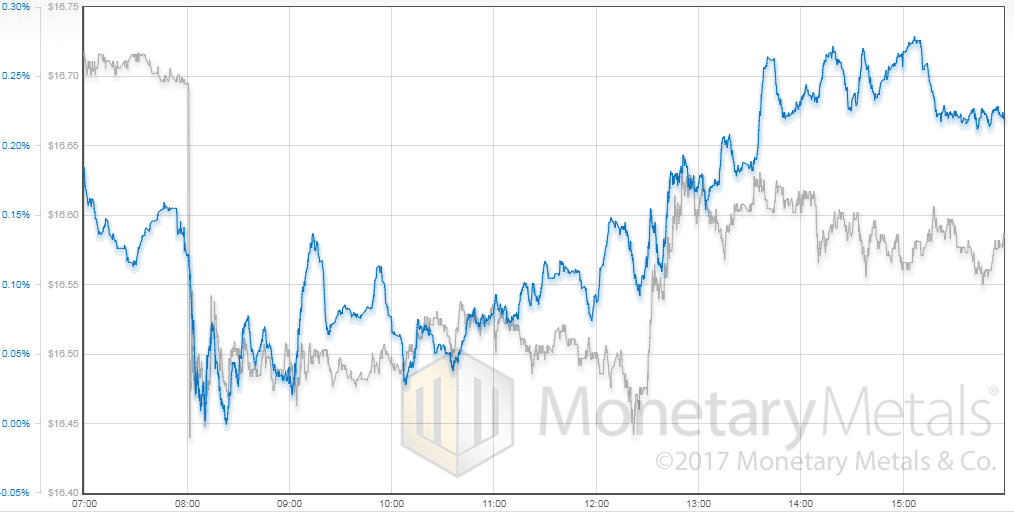
Now let’s look at the silver price along with the September silver basis, which behaved differently.
A 25-cent drop in price and a 15 bps drop in the basis also seem moderate. Futures sold off a bit, but the selling was by no means exclusive to paper.
And then, an hour later, look at the basis action. Someone—or many someones—is bidding up paper. Buying the dip. However, that had no impact on price, so there was also selling of metal. An hour after the buying began, it subsided. But then began anew. And for the next 5 hours, we see sufficient buying of silver paper, that the basis is pushed up above where it had started even though price peaked below the start and then subsided another nickel.
This is what it looks like when exuberance in the futures market meets selling of physical metal. Especially from around 13:30 GMT.
We call ‘em like we see ‘em.
Monetary Metals will be exhibiting and FreedomFest in Las Vegas in July. If you are an investor and would like a meeting there, please click here.
© 2017 Monetary Metals


Keith, with all due respect, I am not convinced that the method you used to analyse this move is correct:
– There is no single large order visible – but that doesn’t mean there wasn’t one placed on the sell side. What the exchange would do in such case is fill the partial order, bid by bid from the buy side. So you would see e.g. 1,000 buy orders all taken out by 1 big sell order, and it would look like 1,000 small trades – correct?
– You will of course argue that this would not be possible since there are upticks visible in the price feed. True…except that the legend indicates VWAP price. If the exchange is flooded with a single huge sell order, then the VWAP will be exactly the buy order queue size…which can be any size for any order, especially when one moves far away from the “stable” price range. So it is very possible to have skewed volume on one side that would make the average price appear to be higher than the median price. Can you confirm exactly what is the formula used for this particular VVWAP, and is there a mathematical possibility of skew to the upside, e.g. if volumes are random and volatile?
Augustin,
We are working from the raw intraday data feed which has each trade and price. At this level of detail you can see individual ticks up and down. For example, here are the six trades before and after the largest trade posted during the period 9:01:00 to 9:01:30
Time Price Volume
9:01:10.514 $1240.80 8
9:01:10.514 $1240.10 9
9:01:10.514 $1240.60 12
9:01:10.514 $1240.20 33
9:01:10.514 $1240.00 84
9:01:10.514 $1240.10 104
9:01:10.514 $1240.00 296
9:01:10.515 $1241.10 1
9:01:10.515 $1241.20 1
9:01:10.515 $1241.20 1
9:01:10.515 $1241.20 1
9:01:10.515 $1241.20 1
9:01:10.515 $1241.30 1
To simplify the chart as there are over 10,000 trades in the three minutes after 9am, I calculated a VWAP for each millisecond by summing the (volume x price) and volume and dividing them by each other – not very complicated formula.
Thanks Bron. Quite convincing explanation, although at such speeds and far away from “equilibrium” price, one has to be really careful before jumping to conclusions. I suspect that internet latency and algorithm latency would start to become measurable with such instantaneous volume peak, so far away from “equilibrium”.
May I suggest that MM have a look at Nanex, who occasionally produce similar, very detailed studies at individual feed and exchange level, to analyse where the orders come from? (you can see their work by searching on Zero Hedge website).