Last week, we talked about the capital consumed by Netflix—$8 billion to produce 700 shows. They’re spending more than two thirds of their gross revenue generating content. And this content has so little value, that a quarter of their audience would stop watching if Netflix adds ads (sorry, we couldn’t resist a little fun with the English language).
So it is with wry amusement that, this week, Keith heard an ad for an exclusive-to-Pandora series. The symptoms of falling-interest-disease are ubiquitous.
Consumers love it. And why shouldn’t they? If a farmer throws a lavish feast to eat his seed corn, of course the revelers will praise him. As free-marketers praise the plethora of consumer products such as the iPhone and the all-you-can-eat Netflix video buffet. They believe these products are the benefit of capitalism. They’re not, of course. We don’t have capitalism. We have central planning of interest rates, and these phenomena are a product of this central planning.
So this week, let’s move to a different topic: Why are wages so low?
The Great Wage Controversy
The Left frames this in collectivist terms. They speak of the “share” of wages, always reverting to their Marxist zero-sum view. They think of the economy as a pie, and therefore capitalists are getting more as workers are getting less. So they want to force employers to pay more (which will be a disaster, for all the reasons discussed in our many writings, plus many more). And they want both a higher tax rate on income and profits, as well as a wealth tax. Socialism seeks out capital, and targets it for consumption.
The Right mostly denies that wages are falling. Indeed, they say wages are rising. “Look! Unlimited movies on iPhones!” They’re eager to head the Left off at the pass, before they can enact more taxes and hike the minimum wage.
The gold community sees this issue clearly. Here is a meme we encounter frequently on social media.
If the minimum wage today were 1.25oz of silver (i.e. $17.86 at Friday’s close), workers would be doing well. If we still had an honest monetary system, based on gold and silver, would the wage have remained this high? Maybe. At least, the drop in wages would be more visible.
Keith wrote an article for Forbes: Measured in Gold, the Story of American Wages Is An Ugly One. In 1965, the unskilled minimum wage laborer made 71 ounces of gold per year. In 2012 (the last year of data available when researching for the article), a senior engineer earned 63 ounces. This is a fact, anyone can do the math. Yet it is so counterintuitive that most people want to argue against it.
Measuring Wages Using Rubber Band Dollars
The point of the article is that—using the dollar to measure them—both prices and wages are rising. People complain only when wages do not quite keep up with prices. We propose an analogy to jumping out of an airplane. You are in free fall, and unfortunately, your parachute kit is falling separately from you. Since it has greater drag, it is falling at a slower rate than you. As the parachute goes out of your reach, you utter words out of frustration.
“My parachute is going up.”
Obviously not. But this line of thinking raises a question. If it really were as simple as rising quantity of money causes rising prices causes loss of purchasing power, then wages and prices would go up at the same rate (no, we’re not interested in the Marxist argument that employers hold back some of their gains from inflation, that markets don’t work). But wages are not rising at the same rate as prices. So there must be another factor at work to cause them to diverge.
Think Spread, Rather Than Price
Diverge? Divergence! This leads us back to one of the most important concept of economics: spread. The spread between wages and prices is widening. Ever since that Forbes article, Keith has been meaning to come back to the topic and address a broader principle.
In researching for that article Keith found that in 1965, it took about 15 minutes of labor to produce a gallon of milk (including the labor that went into raw materials such as feed), plus one acre-hour of land. In 2012, the labor was down to 1.5 minutes, or a 90% reduction. And land was reduced to 0.25 acre-hours, a 75% reduction.
By coincidence, we found this graphic which happens to mention the half-hour of work to buy milk
These are amazing gains in efficiency. However, the worker finds that he does not benefit at all. In 1965, he worked about half an hour to earn that gallon of milk (at the retail price). As of 2012, he’s still working that same half hour.
Do we say that the purchasing power of his labor is the same, therefore no inflation in real terms, therefore all is well with the market? No, that’s utterly wrong.
If you think of the amount of milk as an intrinsic property of the dollar, the dollar’s so called purchasing power, then you cannot see this point. It is not primarily about price. The price of milk has moved and the price of labor has moved basically with the price of milk.
The point is about spread. The spread between these two prices has widened. In 1965, a worker produced four gallons of milk in one hour of work for his dairy farm employer. And on this wage, he could afford to buy two gallons. He was paid half of the product of his labor. In 2012, his labor produced 40 gallons of milk, and his wage still affords him to buy two. He is getting a far smaller share of what he produces.

By coincidence, we found this graphic, mentioning the half-hour of work to buy milk
We suggest that this issue gives insight into the bid-ask spread on labor. The worker is paid the bid price, and the goods he buys in the store are listed at the offer price. In 1965, the offer price was twice as high as the bid price. We can say the bid-ask spread was 1-2. In 2012, the offer price was ten times higher, or the spread was 1-20.
As we often argue with the gold and silver markets, the change in spread tells you more than change in price. Spread is very important, and the bid-ask spread is the most important spread. Labor is one of the most important markets.
Reduced Ability to Coordinate in the Labor Market
The most important spread in one of the most important markets has exploded.
In Keith’s dissertation, he proves that widening spreads indicate a reduced ability of people to coordinate their productive activities in the economy. And now we show that the spread on labor has grown ten times wider. That is really bad.
How do we explain this?
One could try to explain it by the addition of capital into every aspect of the milk production process. Nowadays, cows step onto a turn table, which moves them from station to station, from the computer controlled udder-washing machine, to the automatic feed dispensers that tailors the meal to that cow’s milk production. A greater share of the milk production should be attributed to capital as compared to 1965.
But this is not a satisfactory explanation. For one thing, land is a form of capital, and land usage was cut by 75%. We don’t have price data on dairy automation equipment, but we assume that no farmer would substitute expensive equipment for cheap land.
Part of the reason for the explosion of the bid-ask spread on labor is monetary. But as we see from the above discussion, the mechanism is not falling purchasing power due to rising quantity of dollars. It is falling interest rates. A wage is a cash flow into perpetuity. Every time the interest rate is cut in half, the net present value of a perpetuity is doubled. Therefore, the burden of paying a wage has been increasing since 1981 (when rates began to fall).
With each drop in rates, every existing and potential dairy farmer has an increased incentive to increase dairy production. More milk dumped onto the bid price, results in lower profit margins. Dairy farmers (like video content producers) may be producing more, but they are not profiting proportionally. And, contra Marx, workers are in the same boat as their employers. If profit margins are under intense pressure, neither workers nor owners take home fatter checks.
Capital Consumption
Falling interest causes businesses to feed their investors’ capital to consumers. In the case of dairy farmers, this is literally true. Investment pours in, despite the diminishing opportunity for profit.
This is only part of the reason for the widening bid-ask spread. Another part is: the growth of Leviathan Government. Whatever government spends, that must come out of what everyone produces. In 1965, government spending was 28% of GDP. In 2012, it had increased a bit to 36%. This rise is significant, but it does not explain the tenfold widening of the bid-ask spread of labor.
There is an indirect cost to government, which has grown faster than direct spending: compliance. That dairy farm now must hire its own small army of lawyers, accountants, and food safety officers to defend itself against the relentless onslaught of tax agents, regulators, labor boards, food inspectors, etc. This cost has risen a lot since 1965, but it does not explain the epic increase in the labor bid-ask spread.
We come to one last monetary factor. Speculation. Falling interest rates drive rising asset prices. Chronically rising asset prices set in motion a process of conversion of one party’s wealth into another’s income, to be spent. Speculators are handed free purchasing power. However, there’s a catch as we have said several times.
In order for Paul get something for nothing, Peter must get nothing for something.
There’s your culprit!
Speculators are feasting on milk and everything else. Their milk consumption comes out of dairy owners’ profits and dairy workers’ wages, as well as dairy business capital.
Their feasting not a product of capitalism, any more than the consumer’s feasting on unlimited movies on shiny new iPhones.
We started by saying we were going to change topics. But actually, it turns out that it’s the same topic. Our monetary system incentivizes many perverse outcomes. One of them is falling wages.
If you are alarmed by the widening of the bid-ask spread on labor, if you are outraged by the gutting of the wage, if you are concerned about the future of a civilization that rests on its accumulated capital, while consuming that capital at an exponentially rising rate, then heed our conclusion.
Our defective monetary system is sending false signals, which ultimately destroy the ability of productive people to coordinate their activities. The gold standard enables increasing coordination, which is the antidote.
Keith is working with Nevada, to help them issue a gold bond. He has put up a petition to show the state government that there is support for their move forward, and demand to buy it if they sell it. Please click here for the petition at Monetary Metals, especially if you would consider buying a gold bond. If you’d like to sign, but prefer not to give us your email address, please click here for the petition at Change.org.
Supply and Demand Fundamentals
The price of gold rose six bucks, and the price of silver rose 26 cents. Before we look at the graphs, we want to address a reader question.
This week, someone asked about how we calculate the Monetary Metals gold fundamental price. This is the output of our model, estimating where the metal would be trading if not for the speculators who can push the price around, using extreme leverage in the futures market.
While the formula must remain a trade secret (and we may upgrade it in the next version of our data science platform), we are happy to discuss the theory.
Every week, we show a graph of the gold basis as our picture of the fundamentals. What does this mean, and how is basis showing the fundamentals? The basis is the spread between the spot and futures price. It measured as the actionable trade—i.e. future(bid) – spot(ask), which is the profit that a bank or hedge fund could make. And it is expressed as an annualized percentage, so it is comparable to the interest rate or yield on other assets for the same duration.
This shows the fundamentals for a compelling, but counterintuitive, reason. Arbitrage connects the price of an ounce in the futures market with the price of an ounce in the spot market. They track very closely, and the difference between them—i.e. the basis—is small and pretty stable.
If we see the basis rising, we know that arbitragers are putting on more carry trades. Carry means buying spot, selling it forward, and warehousing it in the meantime. The higher the basis, the more profitable it is to carry. We don’t know how many carry trades are on, but we do know that if the marginal arbitrager walked away yesterday when the basis was, say, 0.5% then he may take it if today the basis is 0.6%. A rising basis indicates metal is moving into the warehouse.
Rising basis means that the marginal demand for metal is to carry in the warehouse.
While there could be continued momentum, this is not a bullish sign. The basis is rising despite this arbitrage. We say “despite” because this arbitrage compresses the basis spread. If it’s rising, then the speculators are buying faster than the arbitragers are adding carry trades. They are bidding up the futures price, while the arbitragers are pulling the spot price up behind it. This metal will come out of the warehouse and back into the market at some point.
Alternatively, if the price of gold is rising and the basis is falling, then we can be sure that there are fewer carry trades (if any) being put on. The rising price is driven by buyers of spot. If the warehousemen are active, they may be selling spot and buying futures, i.e. closing their carry trades.
Our model watches the action from all angles, to calculate a neutral price. This is the price where spot is not being pulled up or pushed down by these arbitrages.
It is not perfect. We mean this both in the sense that the calculation is part art mixed in with the part science. And also, of course, the market is always changing. There are times when we can see a price move counter to the fundamentals, and in due course the price reverses back to where it was. It is tempting to say “we told you so!”
But lest we put on our hubris T-shirts, there are other times where the price moves and the fundamentals later catch up (or down) to the price. It could be that the speculators were right, and they knew what was to come. Or it could be that holders of physical metal reacted to the changing price by buying (or selling).
Stay sharp!
We will look at the supply and demand fundamentals of both metals. But, first, here is the chart of the prices of gold and silver.

Next, this is a graph of the gold price measured in silver, otherwise known as the gold to silver ratio (see here for an explanation of bid and offer prices for the ratio). It turned and fell this week.

Here is the gold graph showing gold basis, cobasis and the price of the dollar in terms of gold price.
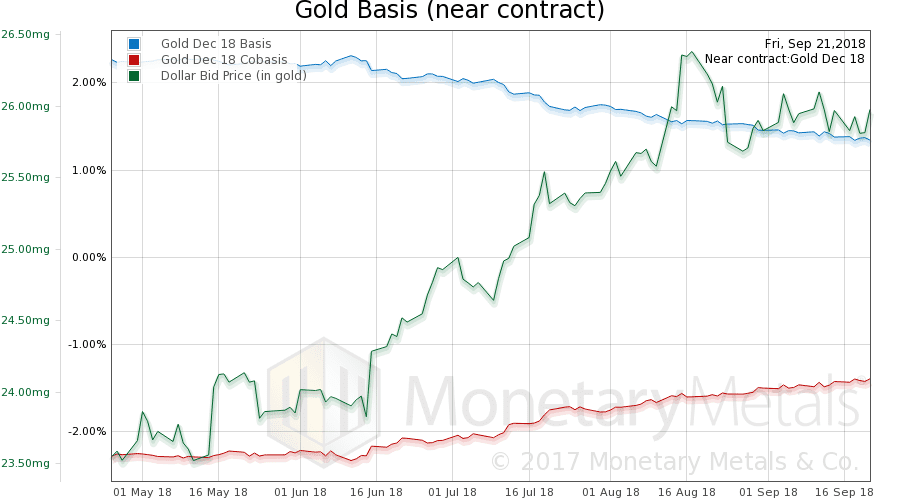
Not a big move in price, but the dollar is down (i.e. the price of gold, measured in rubber-band dollars is up) while the scarcity of gold rises (i.e. cobasis, the red line). At least in the December contract. The gold basis continuous shows a falling cobasis.
This week, the Monetary Metals Gold Fundamental Price fell from $1,373 to $1,358.
Now let’s look at silver.
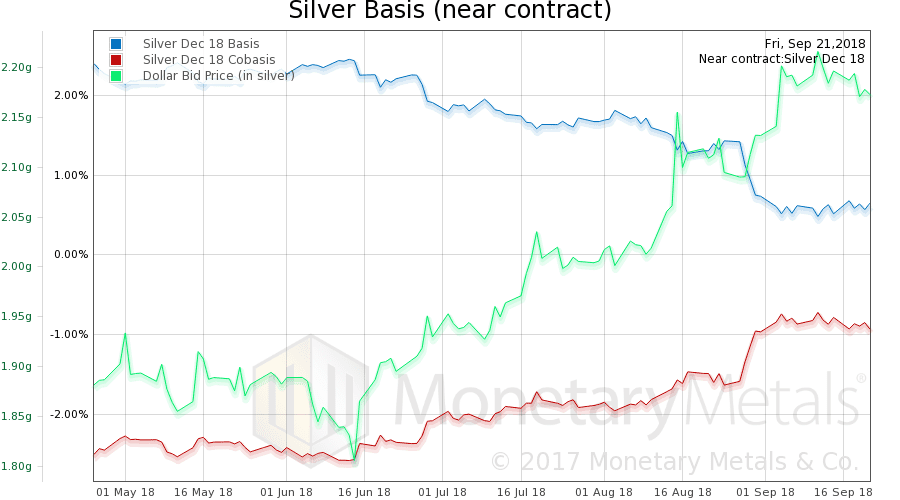
In silver, the price rose by a greater percentage, and the cobasis is falling even for the December contract. As Obi Wan might say, this is not the signal you’re looking for.
Nevertheless, the Monetary Metals Silver Fundamental Price did rise 13 cents $15.94. Let’s see if it holds around the $16 level.
© 2018 Monetary Metals


“Netflix—$8 billion to produce 700 shows. They’re spending more than two thirds of their gross revenue generating content. And this content has so little value, that a quarter of their audience would stop watching if Netflix adds ads.”
If a meat market spends two thirds of its gross revenue buying and preparing meat and a quarter of their customers would switch markets if every package of meat they purchase contained samplers of cereal, vegetables, or soap, how would it follow that their meat has “so little value?”
The customer expects free. Anything other than free, he’s cancelling.
By the way, this is 2/3 gross revenue just on producing new content. They have to spend yet more on license fees for all the other stuff. And then they have all the other costs of running a business.