
Gold Basis (near contract)
This chart shows the near gold futures contract basis and cobasis against the US dollar’s price in milligrams of gold.
The basis is a measure of the per annum return from carrying gold and is an indicator of abundance (the market would only offer a profit to arbitrageurs to stockpile gold if there was excess supply relative to demand). The cobasis is a measure of the per annum return from decarrying gold and is an indicator of scarity (the market would only offer a profit to arbitrageurs to sell gold from their stocks if there was a deficiency of supply relative to demand).
This chart should be read in conjunction with the Gold Carry/Decarry (near contract) chart (that shows the actual dollar per ounce profit/loss) as small dollar values that may not be worth arbitraging can produce larger basis/cobasis percentage as the days to expiry of a contract falls.
Note: this chart switches to the next contract 14 days from the start of first notice day.
3 Month Chart of Gold Basis (near contract)


This chart is also available for a duration of 18 months. Access to this additional chart is free to registered users of this website.
Max Chart of Gold Basis (near contract)


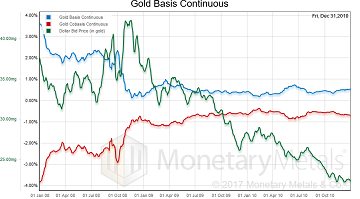
Gold Basis Continuous
This chart shows a continuous (splicing together of individual) basis and cobasis against the US dollar’s price in milligrams of gold.
The basis is a measure of the per annum return from carrying gold and is an indicator of abundance (the market would only offer a profit to arbitrageurs to stockpile gold if there was excess supply relative to demand). The cobasis is a measure of the per annum return from decarrying gold and is an indicator of scarity (the market would only offer a profit to arbitrageurs to sell gold from their stocks if there was a deficiency of supply relative to demand).
This chart is available in durations of 3 months, 3 years and from 1996 to today.
3 Month Chart of Gold Basis Continuous


3 Year Chart of Gold Basis Continuous


Max Chart of Gold Basis Continuous


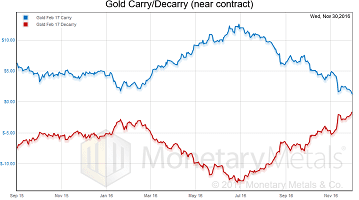
Gold Carry/Decarry (near contract)
This chart shows the dollar per ounce carry and decarry that could be earned on the near gold futures contract.
One carries gold by buying gold at spot and selling a future contract, that is, Future Bid Price less Spot Ask Price. One decarries gold by selling gold at spot and buying a future contract, that is, Spot Bid Price less Future Ask Price.
This chart should be read in conjunction with the Gold Basis (near contract) chart which shows the carry/decarry in percentage terms.
Note: this chart switches to the next contract 14 days from the start of first notice day.
This chart is also available for a duration of 18 months. Access to our charts is free to registered users of this website.
3 Month Chart of Gold Basis in Dollars (near contract)


Max Chart of Gold Basis in Dollars (near contract)


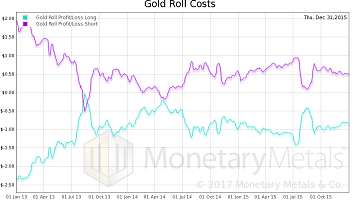
Gold Roll Costs
This chart shows the cost of rolling gold from the near contract to the next contract if one has:
• a long position, that is, sell near, buy next (Near Contract Bid Price less Next Contract Ask Price)
• a short position, that is, buy near, sell next (Next Contract Bid Price less Near Contract Ask Price)
We define the next contract as the current contract as long as it is more than 14 days from the start of its first notice day, at which point we switch to the next closest contract. This chart is available in durations of 3 months, 3 years and from 1996 to today.
3 Month Chart of Gold Roll Costs


3 Year Chart of Gold Roll Costs


Max Chart of Gold Roll Costs


Gold Term Structure
This chart shows the basis and cobasis for all of gold’s futures contracts, positioned on the x-axis according to total calendar weeks to expiry. Similar to an interest rate yield curve for cash, this shows the per annum return for carrying or decarrying gold as the maturity increases.
Note: this chart excludes any contract which is within 14 days from the start of its first notice day or in its delivery month.
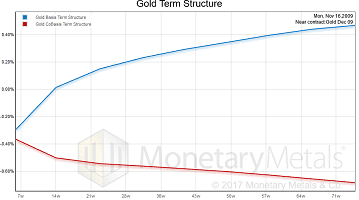
Chart of Gold Term Structure


Gold Basis
All charts are up to date as of Wed, August 16, 2023.

The Case for Gold Yield in Investment Portfolios
Adding gold to a diversified portfolio of assets reduces volatility and increases returns. But how much and what about the ongoing costs? What changes when gold pays a yield? This paper answers those questions using data going back to 1972.

The New Way to Hold Gold
In this paper we look at how conventional gold holdings stack up to Monetary Metals Investments, which offer a Yield on Gold, Paid in Gold®. We compare retail coins, vault storage, the popular ETF – GLD, and mining stocks against Monetary Metals’ True Gold Leases.