
The Fed is Good for Gold, Report 25 September, 2016
It’s almost like magic. The Fed can say something, or in the case of this Wednesday it can say nothing, and gold and especially silver get a boost of rocket fuel.
Actually, the Fed said both yes to rate hikes—in the future—and no to a rate hike now. This was good, if not for people, at least for gold. Well, if not for gold, at least the price of the metal. And especially silver. The price of silver had been up sharply on Monday, it inched up on Tuesday, and shot up another 60 cents on Wednesday, the day of the announcement.
We have expressed our view many times that this is not gold or silver going up, but the dollar going down. Measured in grams of silver, the dollar went down from 1.66 last week to end this week at 1.58, -0.08g or -4.8%.
It’s ironic that last week, we said this:
Just repeat after me: “the Fed makes the economy more stable.”
The dollar is down nearly 5% in terms of one form of honest money. In a week. More stable. Could we be forgiven for quoting the Princess Bride?
“You use that word stable. I do not think that this word means what you think that it means.”
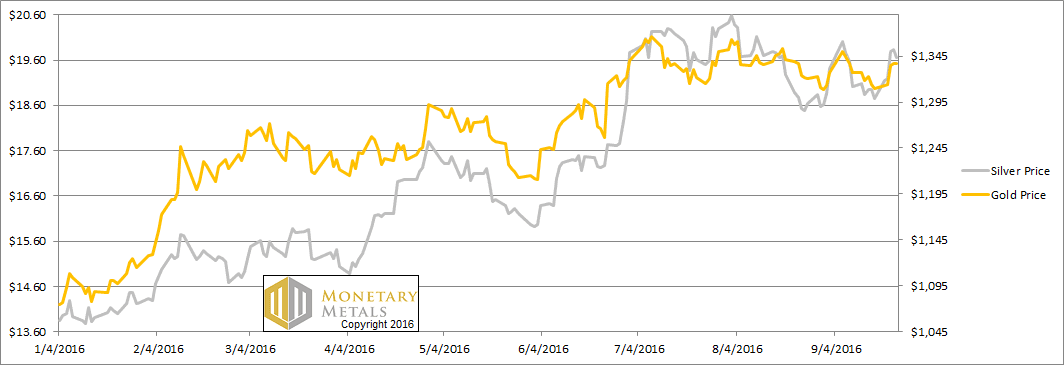
As always, the central question to be answered in this Report is simple. Is this a change in the fundamentals of supply and demand? Read on for the only true picture of the fundamentals of the monetary metals. But first, here’s the graph of the metals’ prices.
The Prices of Gold and Silver
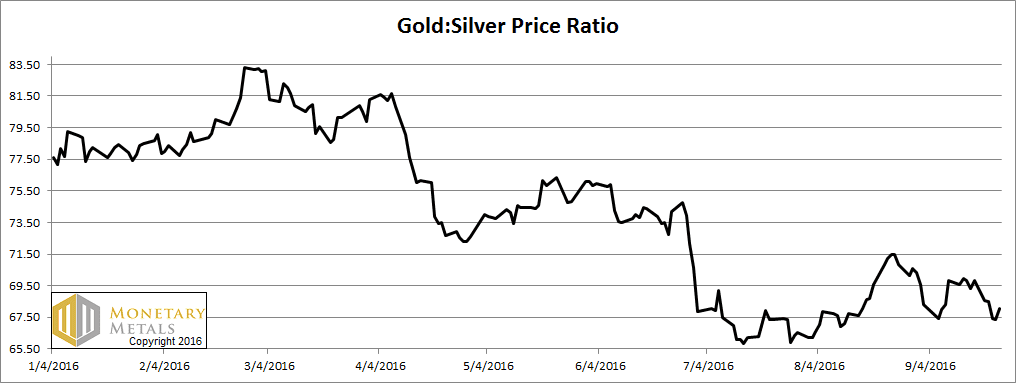
Next, this is a graph of the gold price measured in silver, otherwise known as the gold to silver ratio. It was down sharply this week.
The Ratio of the Gold Price to the Silver Price
For each metal, we will look at a graph of the basis and cobasis overlaid with the price of the dollar in terms of the respective metal. It will make it easier to provide brief commentary. The dollar will be represented in green, the basis in blue and cobasis in red.
Here is the gold graph.
The Gold Basis and Cobasis and the Dollar Price
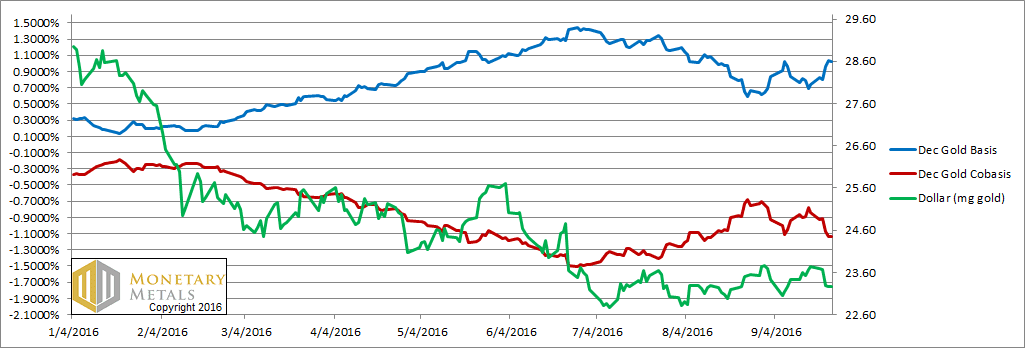
It’s clear from this graph, that the fundamentals of gold did not change. The price of gold was up. On this graph, that appears as a falling dollar price (from 23.75mg gold last week to 23.26mg this week, or about -0.5mg which is -2%).
However, along with this new, higher price of gold we see a new, higher basis (i.e. abundance of gold to the market). The basis is the annualized profit you can make to carry gold, that is buy a bar and simultaneously sell a futures contract. The December basis increase from 0.74% to 1.02%. One percent is not a bad return to make for an investment that will mature in 3 months.
However, it shows just how the gold market is currently structured. The price is held up by speculators buying futures (with leverage, of course). The Monetary Metals calculated fundamental price hardly budged (+$3). It’s $35 below the market price.
Now let’s look at silver.
The Silver Basis and Cobasis and the Dollar Price
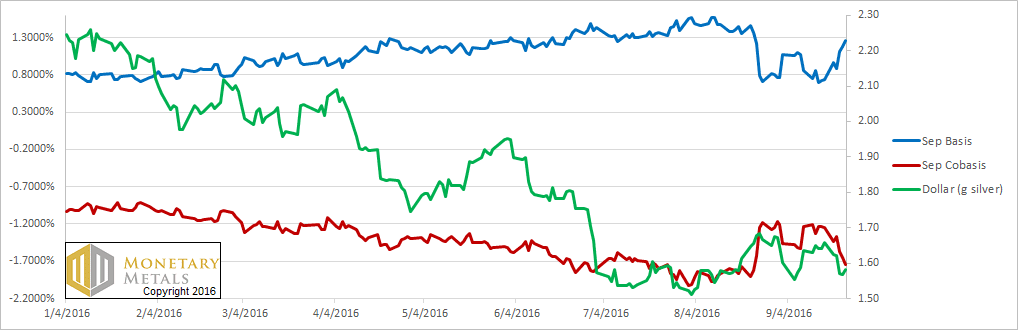
The silver graph shows the same pattern, only with more stark clarity.
The drop in the green line (the price of the dollar, here measured in grams of silver) is much larger than in the gold chart above. And the rise in the silver basis is similarly much larger. It went from 0.73% last week (almost identical to gold) to 1.26%, about double the gain compared to the gold basis.
The frantic bidding up of the silver price in response to the Fed non-announcement is like the dogs salivating in response to Pavlov’s bell. Automatic and unthinking.
There are actually two false premises underlying this knee-jerk reaction. One is that the non-hike by the Fed is going to cause the quantity of dollars to increase. At least compared to whatever market participants previously expected. We’ll leave the debate over the quantity of what is now called money to others. We will just note that the total debt in the system continues on its exponentially rising trend, because it must. There is no extinguisher of debt in our irredeemable currency.
The other flawed idea is that if the number of dollars goes up, then so must the price of gold. The price of gold is not exactly up since 2011 but the quantity of dollars sure is. M0 money supply has nearly doubled in the time that the price of gold has fallen from over $1,900 to its current $1,337. And silver is much more extreme, with its price falling from over $49 to its current level under $20.
By the way, the Monetary Metals fundamental price of silver didn’t budge this week either.
© 2016 Monetary Metals
Wow.
At the time this report came out (on Sunday), the basis was above LIBOR. So a bank could make money by borrowing from another bank, buying gold on the spot market, and then selling in the future’s market.
It is now Thursday and the spot price of gold has fallen pretty dramatically. At the same time, it looks like the basis has fallen to around 0.2%, well below LIBOR.
I also see that the candle for Monday shows a long upper wick. So I guess the banks must have driven up the spot price until the basis collapsed, and then it kept falling afterwards because new supply came in?
The gold basis for December ’16 did not fall to 0.2%. Last quote at 7:15pm Mountain time September 29 has it at 0.873%. Yesterday’s closing 3 month LIBOR quote was 0.83769 %. A good comparison since the December contract is exactly 90 days from expiration. No bank or institution will be borrowing money at LIBOR from another bank, buying gold and selling a future against it to take a tiny 0.036% spread which would disappear to nothing after other costs involved.
Thanks Pizza Genie. Where do you get your quotes from?
I was using this page: http://www.cmegroup.com/trading/metals/precious/gold.html then subtracting spot from future, then finding what percentage that number is of the futures price (using Bing’s calculator). I admit, falling from 1.1% to 0.2% doesn’t sound believable. So I’ve probably made a mistake somewhere.
Is there a resource on the web somewhere that will just quote me the current basis at a particular moment?
Hi Tom, the basis is still circa 1.2%, Pizza Genie’s comments about ensure alignment of time is correct.
Does this mean you guys calculate the basis based on first notice day for the contract rather than the expiration date? Would explain the difference (60 days vs. 89)
Expiration date, but I could see an argument for first notice if your viewpoint is one of rolling the contract or selling out for cash, or maybe some mid point between first notice and expiration as deliveries are spread out.
That CME data is delayed by 10 minutes so you may be comparing real time spot to 10 minute delayed futures. First step would be to get an accurate bid/ask quote with a time stamp for both spot gold and the gold futures contract in question. Goldseek.com has that for spot gold, esignal does as well and it also has delayed bid/ask quotes for futures. There is no gold basis/cobasis quote that I know of so I pull up a spot quote and try to refresh the esignal futures quote to match the timestamp on the spot quote. From there you can get accurate data.
If you read Keith’s explanation of this report the gold basis is future (bid) minus spot (ask). This gives you a cost per ounce to “carry” gold. Divide that cost into the spot (ask) and multiply by 100. Write that number down. As the basis here is quoted annualized as a percentage you need to know the days to expiry for the future in question. So divide 365 by that number, today would be 90, 365/90 = 4.0555555. Take the written down number and multiply by 4.0555555 to get the basis as a percentage. For the cobasis it is spot (bid) minus future (ask) and done basically the same way.
When I have calcualted it like this it is confirmed in this report once it comes out, allowing for some wobble for using different data sources.