
Monetary Metals Supply and Demand Report: April 28, 2013
There were no more Dark Cabal “smashdowns” this week. Gold rose $56, which is to say the dollar fell about 0.9mg this week. The gold bugs may be feeling somewhat vindicated, but what is the basis saying?
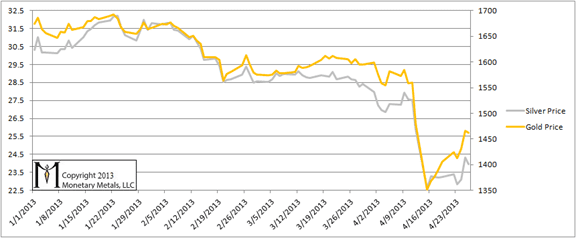
First, here is the graph showing the prices of the metals in dollar terms. There was some up and down motion, but overall the prices ended up.
Gold and Silver Price
One cannot understand the gold market in terms of the quantity of dollars the Fed “prints”, nor by looking at price charts. One must look at the basis (see here for a basic explanation). Week after week, we have been saying that the positive basis, i.e. contango is disappearing (hence the name of this report). This is a process of gold withdrawing its bid on the dollar. One cannot understand this if one lives in the dollar bubble, looking at the gold “price” as if it were comparable to the wheat price or the Mercedes E500 price. What would a falling gold “price” mean? The gold “bull market” is over? And when it rises, does that mean sell to take “profits”?
In this report, we have been tracking the temporary backwardation in both metals.
In the crash of April 12 and 15, the cobasis in the June contract fell below zero; it went out of backwardation. This means that a big part of the price drop was driven by owners of gold metal selling (perhaps to cut their “losses” measured in dollars). After the big plunge, the cobasis began rising along with the price, showing that the price was rising due to buying of physical metal more than futures (more on the futures below).
Gold Basis and Cobasis
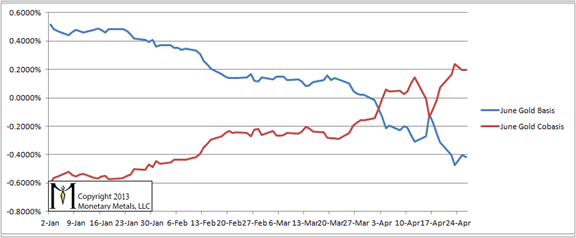
We can see that the cobasis is above zero; June gold is backwardated. But in the past few days, it has come off which means at these higher prices there is more selling of physical metal and/or less buying. No matter what rumors you read of supposedly big traders in London or China, this is the reality. The basis cannot be faked.
Here is the basis chart for silver. We have now moved exclusively to July, as the “roll” is nearly complete and open interest in May has shrunken to a small fraction.
Silver Basis and Cobasis
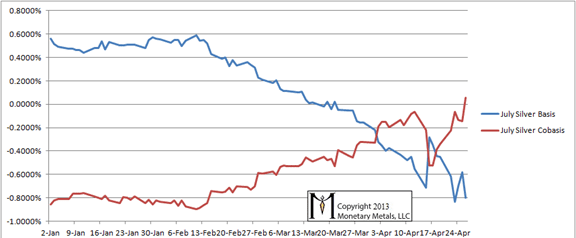
It is no coincidence that this is the time that July silver goes into backwardation. During the “roll” process, there is relentless buying pressure on July. Once the buying is complete, July takes the role that May had previously and is in temporary backwardation. This is the “new normal” post 2008, we keep chronicling.
It will be important to see if the cobasis keeps on rising like this, or if it has topped out for a while
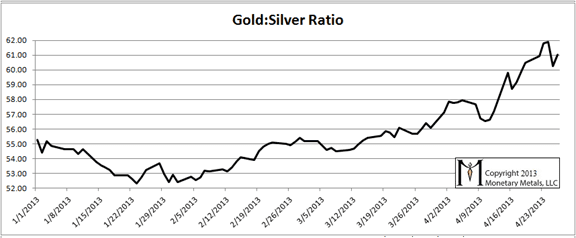
Here is the graph showing the ratio of gold to silver. The trend is still up, even when we take into consideration the major drop on Thursday.
Gold and Silver Ratio
Rather than show open interest again, which we will revisit later, we thought we would show a long-term graph of silver priced in gold, courtesy of our friend Sir Charles at www.pricedingold.com. This is basically the inverse of the gold:silver ratio that we quote. The ratio is how many ounces of silver trades for one ounce of gold. The silver price in gold is the number of grams of gold trades for one ounce of silver). We notice something very interesting.
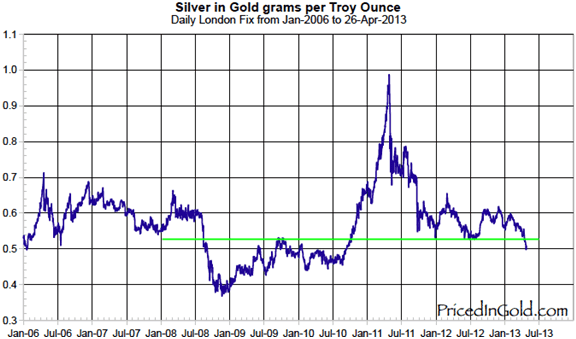
We do not typically focus on technical analysis. But this graph, which goes back to 2006, shows that the recent drop in the silver price takes it below a significant long-term support level at about 0.51g of gold. It is doubly worrisome as the last time this support level broke was in July of 2008.
What’s the source of your basis/cobasis data?
help…. i am a person that has a simple mind, i look at this but i just cant get my mind around this (basis-cobasis) thing is there a more simple way to explain it, yes i mean simple please….., (buy now or wait to see what happens ) just being honest to ask. there is so much hype out there. i am on a journey to protect my family from this criminal world, things just do not feel right in the financial world. thank you.
All the last chart is showing is the global slow down. No need to draw a line to figure that out…
monetary: I generate the basis and cobasis
gold777: You can think of the basis as a measure of gold’s availability to the market. It cuts through all the BS and hype. If the basis is rising, physical gold is becoming available in the market. If the basis is falling, gold is becoming less available. The ultimate scenario proving that is if one must pay $10,000 to buy a physical coin but if one tries to sell a futures contract one cannot get more than $1000.
So you’re taking spot price and future price, computing the average of the two, and plotting the % away from the average of the two that each one is?
Wonder how it would look if you plotted street price of say a one oz gold coin as well as spot price.
How can you distinguish between temporary backwardation and backwardation? The cobasis for both gold and silver seems to be rising and the basis falling and this over several months, that is over several contract rolls.
Both gold and silver are backwardated – could this be a sign that the futures market is drying up vs. the physical ?
thank you, for your answer much appreciated.