
Fed Rate Hike Causes Gold Price Drop, Report 18 December, 2016
The price action was not what most of those in the gold community hoped for (or predicted). The price of gold dropped another $24 and that of silver nearly a whole dollar.
The big news of course is that the Fed hiked rates another 25 basis points. So far, stock market speculators don’t seem to care. They should. The present value of all future earnings depends on the interest rate, and every upwards tick is a substantial downward revision of earnings in out years. However, the bull is so strongly entrenched that it may take a while for this to sink in. We also think of the companies who were borrowing to buy their own shares, and for that matter borrowing to pay dividends. At what interest rate do those two trades stop?
Are higher interest rates bad for gold and badder for silver? Are we close to capitulation in the metals? Readers of last week’s Report know that we put the fundamental prices of gold and silver at $1,190 and just over $15. Where are they now after this week’s action?
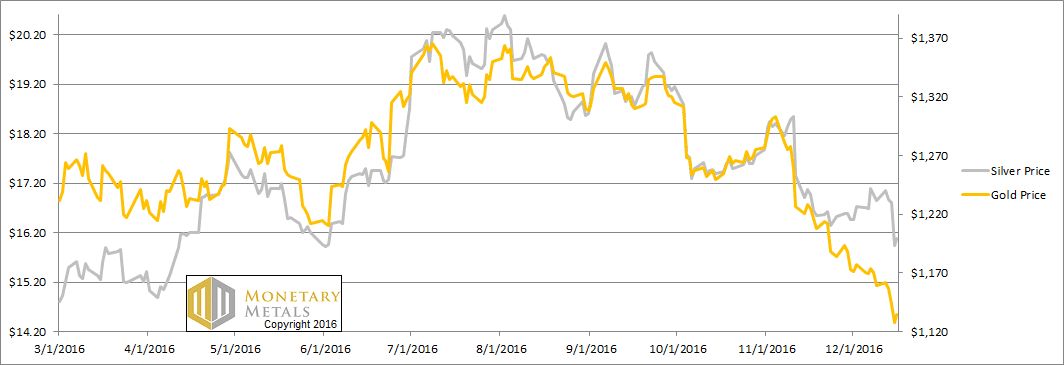
Below, we will give an update on those fundamental pricess. But first, here’s the graph of the metals’ prices.
The Prices of Gold and Silver
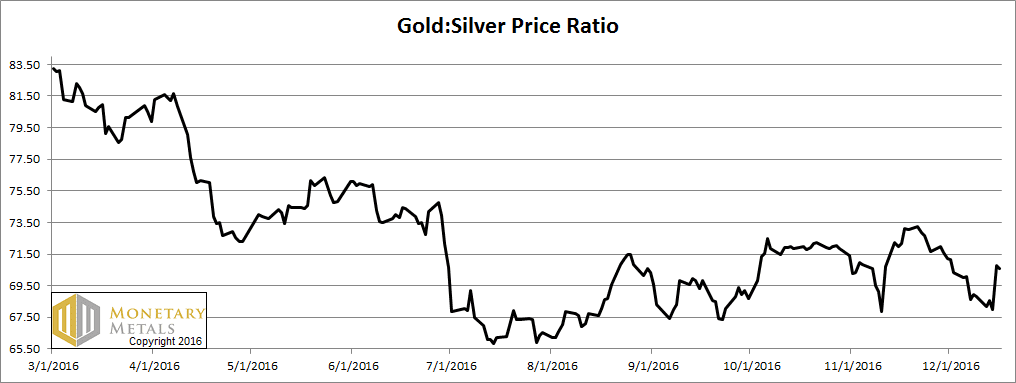
Next, this is a graph of the gold price measured in silver, otherwise known as the gold to silver ratio. It rose sharply this week.
The Ratio of the Gold Price to the Silver Price
For each metal, we will look at a graph of the basis and cobasis overlaid with the price of the dollar in terms of the respective metal. It will make it easier to provide brief commentary. The dollar will be represented in green, the basis in blue and cobasis in red.
Here is the gold graph.
The Gold Basis and Cobasis and the Dollar Price
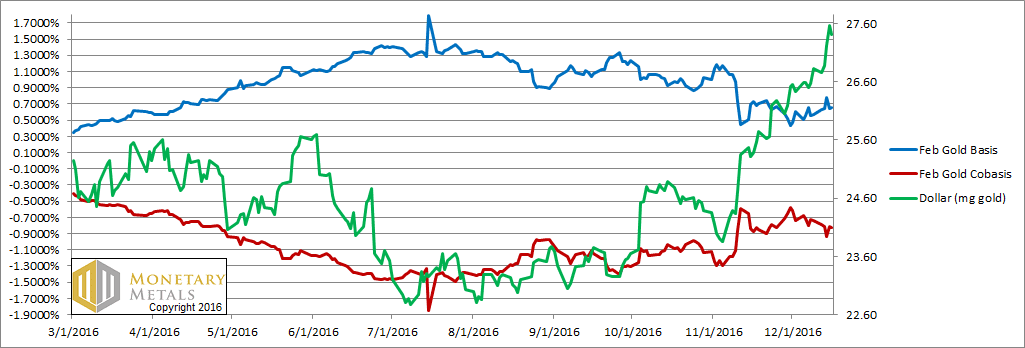
Last week, we said the dollar was shooting the moon. It was then 26.8 milligrams gold. Now it is 27.4, and we had to expand the graph to see the new height.
When speculators sell off their positions, the red cobasis line (i.e. scarcity of gold) moves with the dollar. That is not, however, what we saw this week. Gold became less scarce at $1,135 on Friday than it was at $1,159 a week ago.
That is the fact, and we call it as we see it. Fundamental price is still over the market, just under $1,160.
What makes this both exciting and challenging is that the price at which metal would clear keeps moving, along with the speculators’ effect on the quoted market price. This week, real metal came to market. This is what caused the price drop.
Now let’s look at silver.
The Silver Basis and Cobasis and the Dollar Price
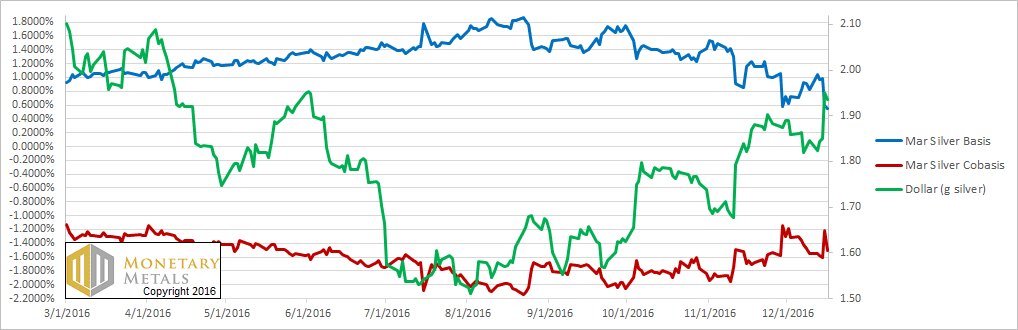
In terms of silver, the dollar rose even more, from 1.85 to 1.94 grams. Unlike in gold, the silver cobasis did rise though not a lot.
And our calculated fundamental price moved up to $15.50.
© 2016 Monetary Metals

” This week, real metal came to market. This is what caused the price drop.”
Looks like ETFs are at it again. And no help is coming from India yet since they lost all of their cash a few weeks ago. But hey, I guess this is a chance for us to stock up.
Once the price reverses, I doubt we’re going to get a chance like this ever again.
Once again the Fundamental price lags like a pathetic moving average. I’ve noticed this distinct lagging characteristic for months and have yet to see anything to change my mind. In other words, never does the Fundamental move dramatically in a bullish or bearish fashion to be followed weeks or months later by price itself. Correct me if i’m wrong. Point is, somehow that Fundamental “anchor” has a way of moving up and down like the rest of things, albeit less so.
Some anchor.
@bbartlow: The fundamental of course leads the way (not lags) but the exact timing of the market to ‘follow the leader’ is quite unpredictable.
Happy holidays to Keith and his team!
If that were true, the fundamental would have skyrocketed in 2010, or collapsed in 2011 before the big drop.
For almost a year “the team” (haha) has refused to publish any back data.. (not the formula, just the data) and readers should begin to question why. Read all the bullish commentary from this website’s author during that time period. You’d be alarmed at the lack of prescience for an indicator that “leads the way”.
It’s all very interesting… but so far no more than that.
This blog was not published until 2013. And even then, the fundamental price wasn’t published until a year or two later. So you can’t test Keith’s indicator with data from that time period or before.
However, if you go back and look at his old posts, the price of gold was trading at a steep discount to its fundamentals in late 2015. In early 2016, this discount was gradually eliminated. And by July, it had become a very large premium. Beginning in around September, this large premium began to be eliminated as the price fell.
It is now back to around fair value.
If you match this information up with data from the World Gold Council’s “Demand Trends Report”, you get further confirmation of what this blog was showing.
If you add up total demand from Jewelry, Bar and Coins, ETFs, and central banks, then subtract recycling and mining output, you find that the growth in demand for the above-ground gold stock outstripped the growth in supply in Q1. But this process reversed in Q2.
So in the first quarter, speculators were behind the curve. They were not bidding the price of gold up fast enough to meet the extra demand coming in. But beginning in the second quarter, they started gaining on physical demand and eventually surpassed it, creating a paper bubble in the gold price.
The fundamentals continued to deteriorate in Q3. But the price didn’t fall fast enough to keep up. Finally, on the evening of Donald trump’s election, the speculators threw in the towel and allowed the market to go back to equilibrium.
So the reason why the fundamental price is currently moving with the market price is because we are close to equilibrium again. As a result, we cannot use this indicator right now to predict where the price is going. But at least we can pay attention in case we start to see a wide divergence between the two prices again.
Of course, we could also just look at the Demand Trends Report to figure this out. But the problem is that it only comes out several months after the quarter ends, whereas this blog comes out once a week.
So the blog is useful.
Here’s the data from the demand trends report for his year:
Demand for new products minus gold recycling, or growth in demand for the above-ground gold stock (expressed in tonnes)
Q1: 928.9
Q2: 722.5
Q3: 651.9
Mining supply + net producer hedging, or growth in supply of the above-ground gold stock
Q1: 774
Q2: 816.9
Q3: 861.8
Demand – supply
Q1: 154.9
Q2: -94.4
Q3: -209.9
The so called “fundamentals” must have firmed up in the last couple of days:
Dec 22 2016 23:48:36 EST
Gold Feb’17 Cobasis: -0.676%
Gold Feb’17 Basis: 0.471%
Dollar @ 27.49mg gold
Dec 20 2016 20:01:30 EST
Gold Feb’17 Cobasis: -0.944%
Gold Feb’17 Basis: 0.745%
Dollar @ 27.52mg gold