
Illicit Arbitrage Cut by Tax Cuts and Jobs Act, Report 3 Sep 2018
This week, we are back to our ongoing series on capital destruction. Let’s consider the simple transaction of issuing a bond. Party X sells a bond to Party Y. We will first offer something entirely uncontroversial. If the interest rate rises after Y buys the bond, then Y takes a loss. Or if the interest rate falls, then Y makes a capital gain. This is simply saying that the bond price moves inverse to the interest rate.
However, it is highly controversial for some reason, to note that X is on the other side of the trade. If Y takes a loss then it is X’s gain. If Y makes a gain, then it is X’s loss. Party X is short the bond, and Party Y is long. When the price of an asset moves up, shorts lose and longs win. When it moves down, shorts win and longs lose.
We have had a falling interest rate environment since 1981 (with corrections).
That would have dealt ruinous losses to bond issuers.
Callable Bonds
So the bond issuers adapted to this environment by putting a call clause in their contracts. This gives them the right, after a certain amount of time, to buy their bond back at a pre-determined price. Why would they want to do that? The price has gone up, so they can buy the old one back below the new market price, and sell a new one at the market price.
It’s a nice bit of judo. They turn the tables on the bond buyers. Now, when rates fall, it is the buyers who take a hit.
Consider as an example, a pension fund that owns a portfolio consisting of assets recently bought at low yields, plus older assets with higher yields. A recent bond might be yielding 2%, but that’s balanced by an old one at 6%. The blended rate of return is 4%.
Put yourself into the position of the fund manager. As each old bond matures, you buy new bonds with lower yields. Your actuaries tell you that you must get 6% to ensure the long-term solvency of the fund. And then it happens.
One day, your 5% asset is gone. In its place is zero-yield cash. What will you do? (No, you don’t go out and spend it, driving up consumer prices!) You have to buy another 2% asset. Your fund’s race towards insolvency accelerates. Or else, you could move out on the risk curve, and chase the 6% you need…
Another Proof Point of Falling Interest Rate Trend
As an aside, the fact that bond sellers can put in clauses that buyers hate, is an interesting indicator. In any other market, it would be obvious. If sellers can dictate terms, and buyers must meekly accept them—it’s a seller’s market. That means that either supply is weak or demand is strong.
It’s not clear in bonds but for one reason…the Quantity Theory of Money. Rising quantity of dollars is supposed to cause rising prices and hence rising interest rates. So people look at three and a half decades—an entire career!—of falling rates, and think “it’s cyclical.” They eagerly anticipate each little correction, which they assume is the long-awaited return to normal rates (whatever normal means in a market falling for so long).
Yet, the fact is that sellers dictate an important term that buyers hate. Sellers use it against buyers time and again. It’s an incontrovertible signal that the bond market is a seller’s market. In a seller’s market, sellers have pricing power. So it’s a market with chronic pressure pushing prices up.
Which means chronic pressure pushes interest rates down.
Anyways, back to the topic. Whenever government controls a price, it creates a conflict. Of course buyers want a lower price and sellers want a higher price. Both sides must lobby, overtly or in smoke-filled back rooms. They must donate money, kiss rings, and generally make obeisance to politicians. It’s easy to see why politicians love this kind of environment.
Who Wants Lower or Higher Rates?
The interest rate fight has to be one of the greatest lobbying battles of all time. On one side are all the investors: pension funds, insurers, annuities, etc. This side wants stable interest rates high enough to cover their nut. On the other side are all the borrowers: governments at every level, and major corporations. This side wants falling rates.
And there is one area of mass confusion. When rates fall, as we discussed above, bond prices rise. So traders—as opposed to investors—want falling rates too. Traders can capitalize on the so called wealth effect, get something for nothing, and consume other people’s capital.
Of course, institutional investors can’t trade this way. And equally of course, a whole economy cannot trade its way to get rich on capital gains. In order for one party to get something for nothing, another must get nothing for something.
We believe the interest rate conflict is intractable. Not just for the size of the forces arrayed on both sides but, more importantly, for economic reasons. Keith’s theory of interest and prices explains why rates are falling.
However, there are skirmishes on other ground. For example, the call option we mentioned earlier. Investors may not be able to affect the rate of interest, but they can attack the tactics used by the borrowers to exploit the falling-interest environment.
Without a call option, borrowers suffer losses on their outstanding bonds. Bonds are going up, and they are stuck with a short position. In other words, they borrowed at a too-high rate. The call option lets them take back their bond below the current market price.
Investors so far have not been able to get Congress to outlaw call options in bonds. But they did find a way to attack one vehicle commonly used by municipalities. It’s called the advance refunding bond.
Advanced Refunding Bonds
When a municipality sees that rates have fallen, but the callable date on their bonds is still a few years away, they sell a new bond and use the proceeds to buy Treasury bonds. This allows them to lock the lower rate now, and remove the risk that the rate could bounce back by the time the bond is callable. And it allows them to start saving interest expense now.
It’s also perverse as hell! A municipality, we’ll call it Arbitrageville, sells a $100 million bond to at 5%. It uses the proceeds to build some roads. Next year, the rate drops to 3%. Unfortunately for Arbitrageville (but happily for the investors) the bond is not callable for another four years. However, Arbitrageville has a way to exploit the drop.
It sells a new $100 million bond, the advance refunding bond. With the proceeds, it buys a Treasury that may be trading at 4% (being that the Treasury is taxable to most investors, but obviously not to city governments). Let’s look at the math.
Arbitrageville is paying $5 million a year to service its old bond. Now it adds $3 million to service the advance refunding bond. So the total interest expense is $8 million. However, it is getting $4 million on the Treasury bond it holds. So net interest expense is $4 million. Arbitrageville is saving $1 million a year for the next four years until its old bond is callable. And then it will sell the Treasury and use the proceeds to call the old bond. After that, it is paying $3 million in annual interest expense.
For over three decades, this has been the pattern. Rinse. Repeat.
Churn Adds to GDP
This is a process of churn. While borrowers may feel they have gained, the net economic effect is capital consumption. And on top of that, banks generate fees at each step. Issuing a new bond, calling an old one, and even buying and selling Treasurys. It’s not that the banks covertly break the law. It’s that they make an illicit (in the sense of wrongful, though perfectly legal) rake over part of the economy. They are profiteers on a government-created problem: falling interest rates.
According to Thomson Reuters, $91 billion worth of advance refunding bonds were sold in 2017 (which we assume is a big drop from 2015, as the interest rate has risen since then). Just going with this number, assume total fees generated on this is 1%—bankers, brokers, lawyers, escrow agents, etc. That is nearly a billion dollars in revenue. A billion dollars added to GDP (or more, if some of these earners leverage their income to spend even more). We hope this makes it clearer why we oppose GDP as a measure of the size of the economic. Churn and capital consumption add to GDP.
It gets worse. Municipalities know that their right to sell assets which pay interest tax-free to investors gives them a lower interest rate. They have long ago discovered that they could actually sell bonds for no purpose other than to buy Treasurys. They can profit from the tax arbitrage. If “perverse” does not describe this, we do not know what does. This is another illicit arbitrage.
So what typically happens in cases where government interference in a market opens up an opportunity for illicit arbitrage? Wrong, grasshopper, the government does not cease and desist interfering! Take off 10 points from your exam paper, and sit in the corner with that pointy cap labelled “dunce”!
Tax Cuts and Jobs Act of 2017 to the Rescue
No, what happens is they impose more regulations. Particularly because it’s impossible to tell the difference between East Arbitrageville who sells an advance refunding bond with the intent to fund the call of its old bond, and West Arbitrageville who sells a bond purely to exploit the muni-Treasury interest rate spread.
In any case, the Tax Cuts and Jobs Act of 2017 has attacked advance refunding bonds with a new vector. Advance refunding bonds are no longer tax-exempt to investors.
It matters little at the moment, in the throes of this bond market correction. But when the bull market in bonds (i.e. falling interest rate trend) resumes, municipalities will be dealt massive losses.
We realize that conventional accounting does not recognize the loss. However, we insist that if you have borrowed at a higher rate than your neighbor, and thus have a higher payment, then you are in a weaker financial position than him. Your books ought to recognize this.
The Lady Tiger or the Tiger
So which is worse: (A) forcing investors to replace their highest-yielding assets with lower-yielding assets, or (B) forcing debtors to incur potentially unlimited losses as interest falls and falls? We will give a hint: our debt-backed, debt-based monetary system lives off the backs of debtors.
We frame the question that way, because both are terrible outcomes. Central planning and price controls creates a conflict of interest. Of course, both sides of the conflict wave the American flag and try to position themselves as the paragon of the public interest. However, by favoring either side, the government not only harms the other side but impoverishes everyone.
And though monetary planning is the least understood, it is the most pernicious.
We need to transition to a free market in interest rates. This is not possible in irredeemable paper currency, because the government has removed the choice to redeem, to hold money without being a creditor. One can hold gold, but then one incurs price risk.
We believe Monetary Metals’ auction process for gold fixed income is the first free market in setting an interest rate since the Federal Reserve was created over a century ago. Investors have the choice to invest and get interest to their preference, or to not invest and keep their gold.
The world needs to transition to this kind of free market, not just for leasing gold, but for bonds and all credit. In fact, we are working on that transition, with the state of Nevada, and now they have pending legislation to issue a gold bond. This is a giant step toward the gold standard.
Keith has put up a petition, and is asking for everyone who cares about honest money to show Nevada that you support their move to gold bonds. Please click here for the petition at Monetary Metals, especially if you would consider buying a gold bond. If you’d like to sign, but prefer not to give us your email address, please click here for the petition at Change.org.
Supply and Demand Fundamentals
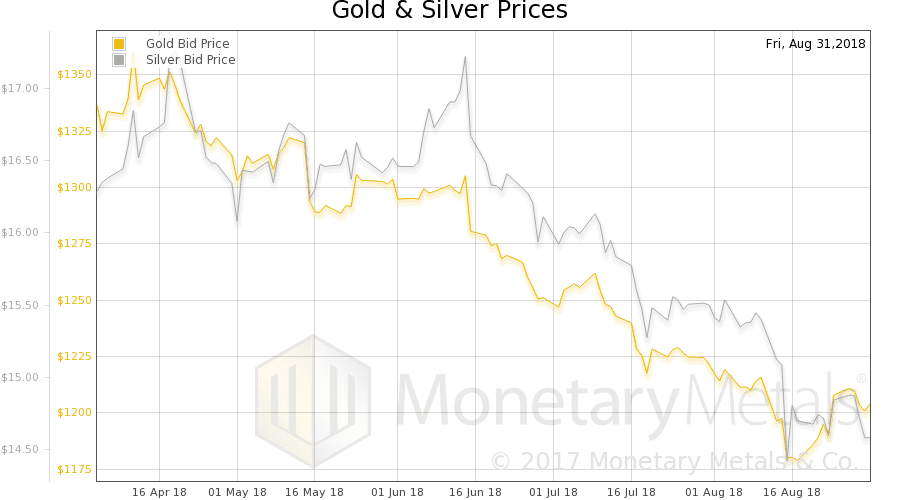
The price of gold fell three bucks, and that of silver fell a quarter of a buck. But let’s take a look at the supply and demand fundamentals of both metals. Also, we have an interesting development in the gold-silver ratio, a topic we have not addressed in a while.
First, here is the chart of the prices of gold and silver.
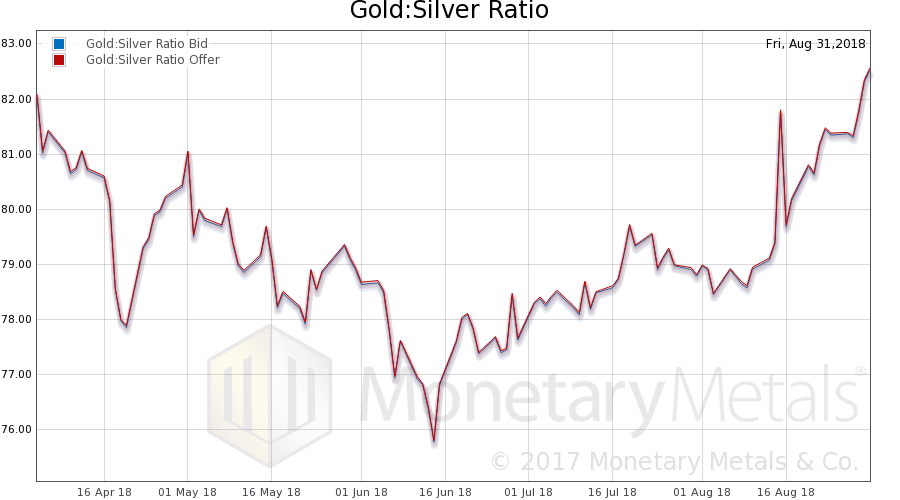
Next, this is a graph of the gold price measured in silver, otherwise known as the gold to silver ratio (see here for an explanation of bid and offer prices for the ratio). It rose further this week.
Here is the gold graph showing gold basis, cobasis and the price of the dollar in terms of gold price.
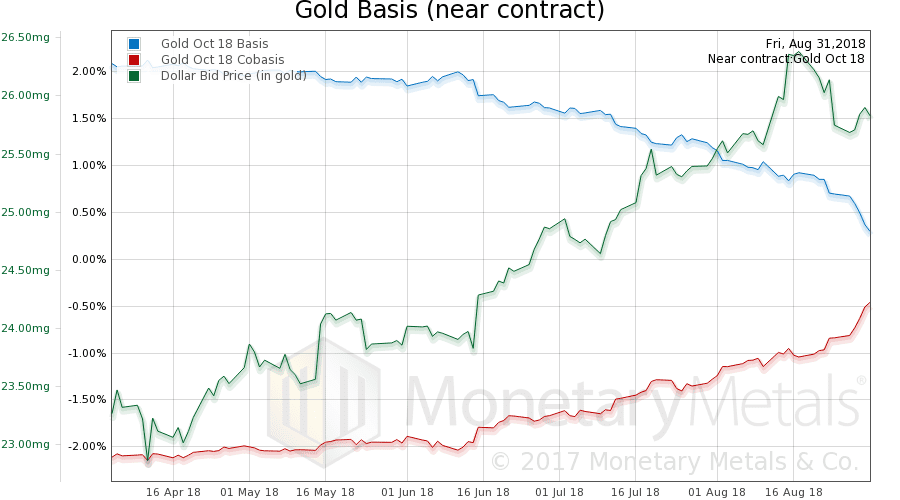
The October contract shows an increase in scarcity (i.e. cobasis) of gold, though it should be noted that the December cobasis increased less, and the gold cobasis continuous does not increase.
This week, the Monetary Metals Gold Fundamental Price rose another $10, from $1,366 to $1,376.
Now let’s look at silver.
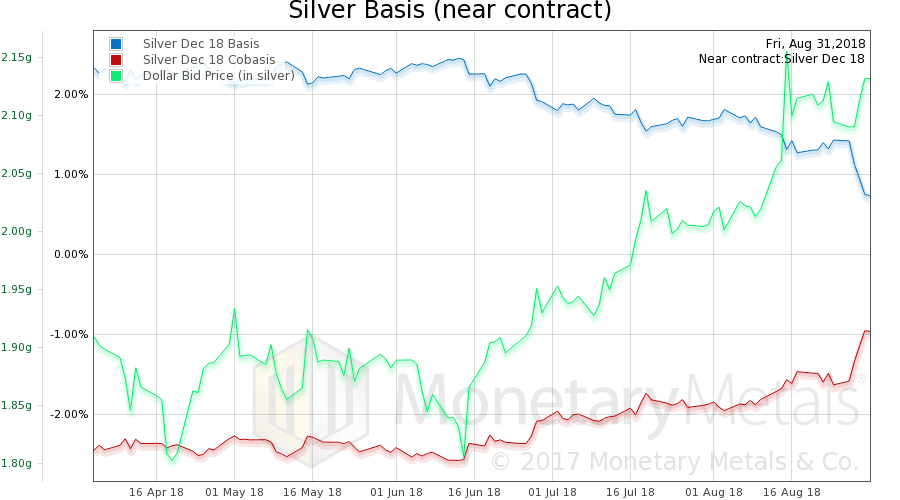
The December silver cobasis looks like the October gold cobasis (50bps lower in absolute magnitude than Oct gold, but higher than Dec gold). Rising scarcity. And the same occurs in the silver cobasis continuous.
The Monetary Metals Silver Fundamental Price rose 30 cents, from $15.78 to $16.08. This is the same level it held on August 13. So we are potentially seeing a fundamental price bottom, after a falling trend that began May 21 and lasted almost three months.
Now let’s turn to the gold-silver ratio. Here is a picture of the gold-silver basis ratios. It is the ratio of the gold basis to the silver basis, and the gold cobasis to the silver cobasis.
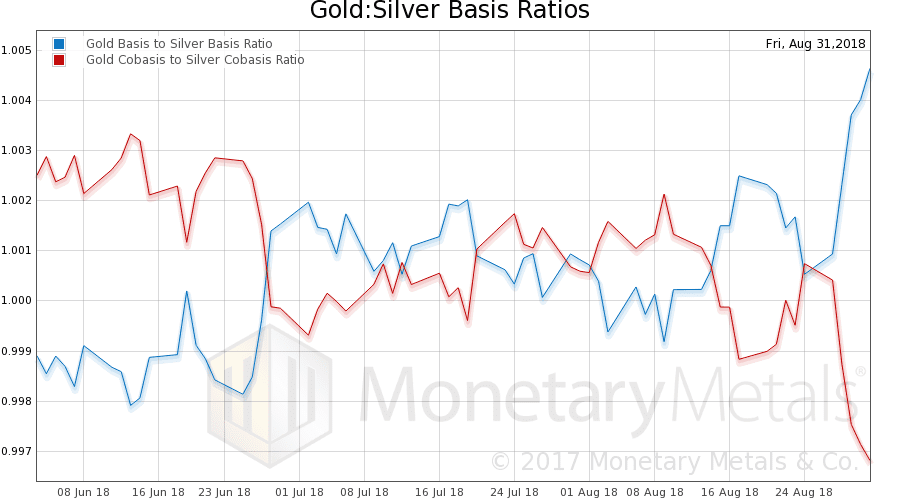
Being ratios, they are telling us about the relationship between the gold fundamentals and the silver fundamentals. If the gold basis is rising relative to the silver basis, it means the abundance of gold is rising faster. If the gold cobasis is falling relative to the silver cobasis, it means the scarcity of gold is falling faster. Or the abundance of silver is falling faster, and scarcity of silver is rising faster.
This chart is suggesting that now may be a good time to trade one’s gold for silver.
However, before you place that order, let’s zoom out and look at the three-year chart (also on our website).
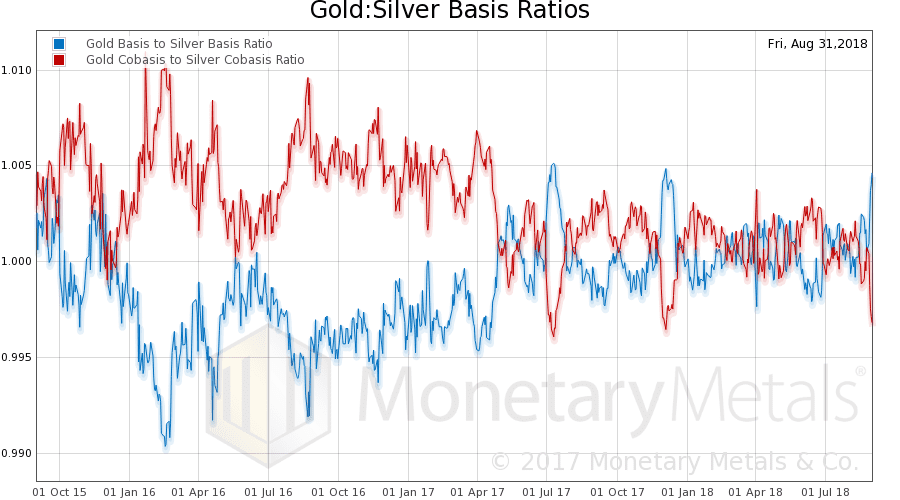
This is the best time to trade gold for silver in the last three months, alright. But if basis ratio gets over 1.05 then it will be the best time in the last three years (this ratio hasn’t spent more than two weeks or so above 1.05 since 2009).
By the way, the last two peaks were both in 2017: Jul 10 and Dec 4. At the July peak, the gold-silver ratio hit a peak over 79. It subsequently fell to 74.2 (-6.1%) about two months later. At the December peak, the ratio was 78.4, and fell to 76.6 (-2.3%) a month later.
This time, the gold-silver ratio is higher, currently 82.7 as of Friday’s close.
We will keep you posted, as this setup either grows or fizzles.
© 2018 Monetary Metals


Leave a Reply
Want to join the discussion?Feel free to contribute!