
Monetary Metals Supply and Demand Report: July 21, 2013
“Gold went up $11.70 this week,” is how most people would say it. This would be perceived as good news amongst the gold bugs. Of course, Monetary Metals looks at it differently. We say, “The dollar fell this week.” Expressing it this way makes it clear that there is no cause for celebration. As we see from looking at the gold basis, owners of gold are in the process of withdrawing their bid on the dollar.
As we go forward, there is more and more boilerplate material in this report. This is good for first-time readers or as a refresher. But if you are reading it every week, you may want to skip over it. To make the report more readable by both groups, all repeated boilerplate material that is repeated from the prior week is be marked in italics like this.
The Gold Basis Report is fundamental analysis of gold and silver. The basis is a measure of availability of metal to the market. When the basis is high and rising, then metal is abundant. When the basis falls below zero, and the cobasis rises above zero (gold goes into backwardation) then that means danger (and likely higher dollar prices).
The basis doesn’t measure flows of metal from one corner of the market to the other. We make no assumptions that one side is the “dumb” money and one side is the “smart” money. The basis measures the spread between the spot price and the futures contract price.
Obviously, the recent falling price tells us that demand for gold and silver is lower. But the basis is also falling, and this tells us that those who do buy gold want it now. They are willing to pay a premium to get it now, and don’t want to wait until August for gold or September for silver.
Since gold and silver have huge inventories that are not consumed—they are held for monetary purposes—a sign of scarcity of the monetary metals in the market is a sign that the dollar is moving towards collapse, when gold will no longer bid on it.
One cannot truly understand the gold market in terms of the quantity of dollars, price charts, or by charts of open interest, ETF holdings, COMEX inventories, etc. One must study the basis.
In general, the positive basis (i.e. contango) is disappearing (hence the full name of this report). This is a process of gold withdrawing its bid on the dollar. One cannot understand this if one lives in the dollar bubble, looking at the gold “price” as if it were comparable to the price of Apple shares or crude oil.
The “bull market” in gold and silver is not over. We do not recommend that anyone sell his gold now, unless he is using leverage (and we don’t recommend using leverage). When the gold price rises, we don’t recommend selling then, either. A rising gold price gives only an illusion of profit (and the tax man will take a big piece of that).
We generally prefer to look at the price of the dollar in terms of gold, rather than the price of gold in terms of the dollar. The reason is simple. One can measure a rubber band using a steel tape, but not a steel tape using rubber bands.
As noted above, the dollar fell a bit. It is now about 24mg gold. This is still high by recent years, but off the high set a few weeks ago of about 26mg.
The Price of the Dollar
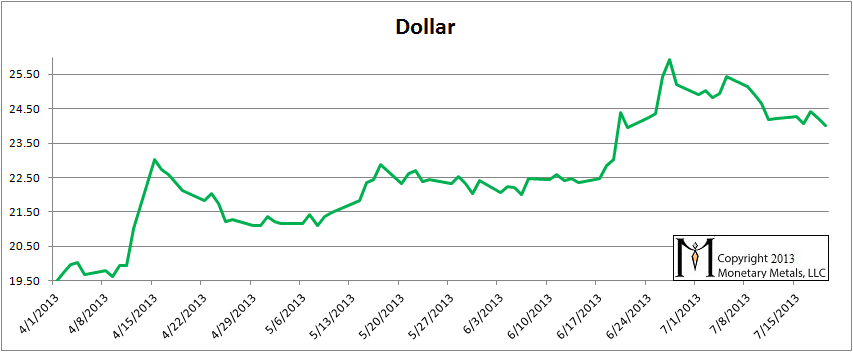
We believe that the dollar has been getting stronger for the simple reason that debtors are being squeezed. They are scrambling to get dollars. It is not just Japan with a collapsing bond market but possibly China as well. If this gets going in any significant way, the price of every asset from copper to real estate in LA could crash.
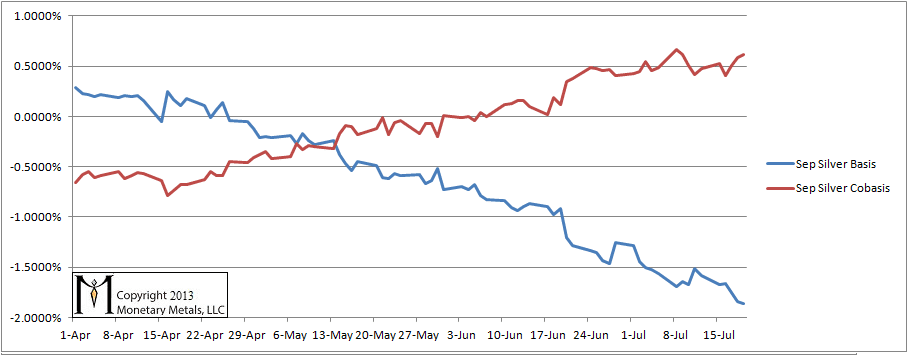
In this report, we have been tracking the temporary backwardation in both metals. It is like a distortion field; as we move closer to each futures contract expiry, that contract is pulled into backwardation. The bid drops, which causes the basis to fall off the bottom of the chart. This could be due to heavy selling, as naked longs must sell before First Notice Day (since they haven’t got the cash to buy the metal). Their selling, of course, presses down the bid.
But the mechanics of the contract roll does not fully explain the phenomenon. For one thing, the distortion field is wider for silver than for gold. The basis for September silver has been falling in earnest since shortly after the April 15 crash. This shows that scarcity is increasing at the lower price.
Think of temporary backwardation as rot in the heart of a tree. It can spread for years, undermining its integrity. The collapse of the tree at the end is “unexpected”. As the financial system rots, people increasingly discount monetary metals for future delivery. Despite the cost to carry gold, it is cheaper to buy gold for delivery in August than it is now.
You could lock in the price now, and not have to come up with the money for a few months. And you are offered a discount to do this. Few people appreciate the significance, just as only a tree surgeon would recognize the rot in the heart of a tree.
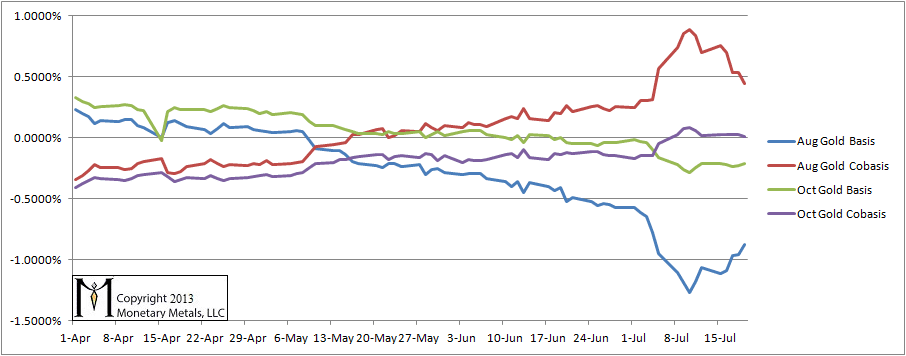
For gold, we now show both August and October, as August is in the middle of the contract “roll”. This is when the “naked longs” must sell, and if they wish to remain long gold they can buy October or some other month. This puts pressure on the bid for the August contract, which we should see as a falling basis. It also puts pressure on the offer for October and December, which we should see as a falling cobasis.
Indeed, we see a falling cobasis in October this week. October is close to departing the state of backwardation. But we do not see a falling August basis. Against the contract roll mechanics, we see a rising basis in August. More physical gold came to market, or else less physical gold was demanded (look for Keith Weiner’s separate article this week on the negative GOFO rate for more discussion of what may be occurring).
Gold Basis and Cobasis
Here is the basis chart for September silver. Silver still does look like it wants to get scarcer. The cobasis rose, but not above its peak set a few weeks ago.
Silver Basis and Cobasis
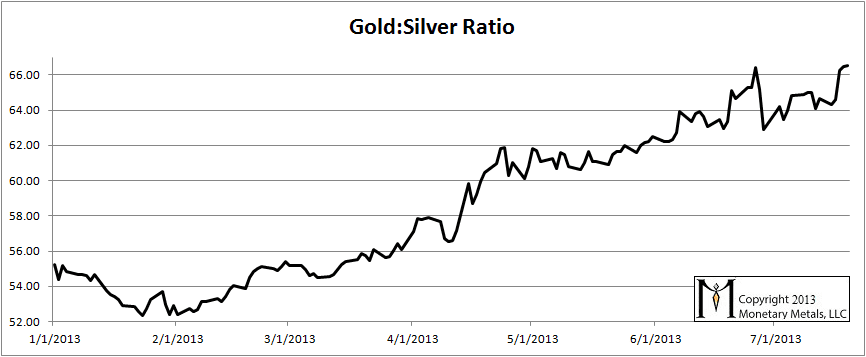
Here is the graph showing the ratio of gold to silver. It rose sharply to a new high.
Our prediction (in a video and articles) was for the ratio to reach at least 60 and maybe 70. At the time, the ratio was 52.
Last week we wrote, “At the moment, we would not bet either on a rise or a fall of the ratio.” If we had to pick a direction, we would guess upwards. But we would not necessarily bet on it. Right as we turned out to be, it was not a bet we cared to make. We are still in the same ambiguous-but-leaning-towards-gold mode as last week (as we wrap up this report Sunday evening, the prices of both metals are up in dollar terms and the ratio has fallen to 66.1).
Gold to Silver Ratio

Humm ,
Interesting , being expatriated in Turkey it allows me to compare on the ground how a “physical” country reacts. I think my remarks could be extended to some other countries (muslims ones) , Guess what :
1-Turks buy physical (gold is definitelly in the street)
2- Ramadan started on July 08th
3- in the bazzar at the moment it is empty (ramadan) and when you speak with gold dealers it is perfectly normal due to the previous explanation . During this period Turks don’t buy quite a lot of gold.
4- Ramadan is finishing on August 07th but the “movement” in the bazar will start around 10 days before (end of July)
Why has this backwardation happened in the midst of bear markets? Your basic thesis is that it is a sign of super bullishness.
My experience is that in general backwardation is bullish at the terminal phase of a bull market. But it terminates the move.