
Monetary Metals Supply and Demand Report: June 2, 2013
Gold is bouncing around near its post April 15 low, and silver is on it. Will the dollar break higher and thus bring more pain to the gold bugs? Will the dollar break down from here? Rather than looking at price action, we prefer to look at the fundamentals. The basis is a measure of scarcity of the metals on the market. In this week’s report, we will look at what the basis can and cannot tell us about the likely next price move.
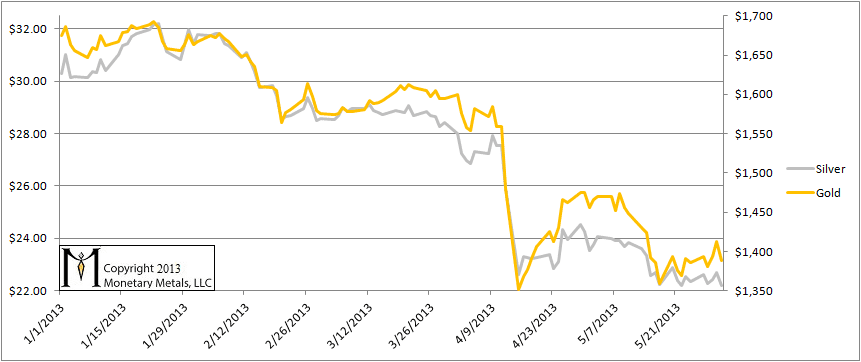
First, here is the updated price graph.
Gold and Silver Price
One cannot truly understand the gold market in terms of the quantity of dollars, price charts, or by charts of open interest, ETF holdings, etc. One must study the gold basis (see here for a basic explanation). Think of the basis as a scarcity indicator. Since gold and silver have huge inventories that are not consumed—they are held for monetary purposes—a sign of scarcity in the market is a sign that the dollar is moving towards collapse, when gold will no longer bid on it.
The positive basis, i.e. contango is disappearing (hence the name of this report). This is a process of gold withdrawing its bid on the dollar. One cannot understand this if one lives in the dollar bubble, looking at the gold “price” as if it were comparable to the wheat price or the Mercedes E500 price. What does the falling gold price mean? It means the dollar is getting more valuable. Why? We published an article presenting our theory.
No, the gold “bull market” is not over. We do not recommend that anyone sell his gold now, unless he is using leverage (and we don’t recommend using leverage). When the gold price rises, we don’t recommend selling then, either. A rising gold price gives only an illusion of profit (and the tax man will take a big piece of that).
In this report, we have been tracking the temporary backwardation in both metals. It is like a distortion field, as we move closer to each futures contract expiry, that contract is pulled into backwardation. The bid drops, which causes the basis to fall off the bottom of the chart. This could be due to heavy selling, as naked longs must sell before First Notice Day (since they haven’t got the cash to buy the metal). This selling must be on the bid, which would press it.
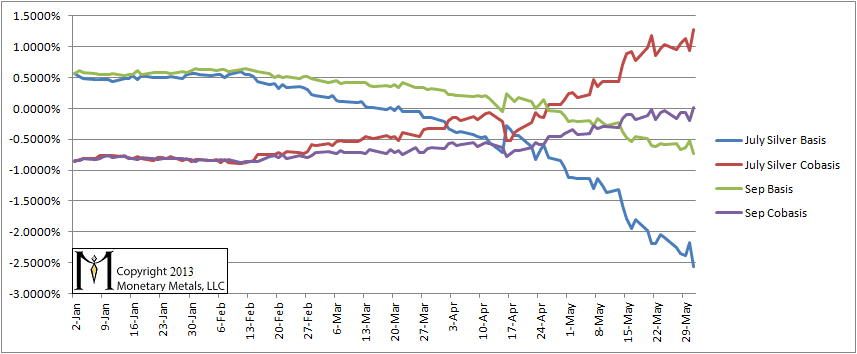
But this does not fully explain the phenomenon. The basis for September silver has been falling in earnest since shortly after the April 15 crash. This is commensurate with a theory of rising scarcity at the lower price, rather than merely reflecting the mechanics of the contract roll.
It is not just that the basis is falling. The cobasis is rising. On Friday, the cobasis for September silver was positive—backwardation. This means the ask on the future is also falling, with the basis.
Basis = Future(bid) – Spot(ask)
Cobasis = Spot(bid) – Future(ask)
Think of this as rot in the heart of a tree. It can spread for years, undermining its integrity. The collapse of the tree at the end is “unexpected”. The financial system is rotting. People are increasingly discounting monetary metals for future delivery. When they want it, they want it now. Not that many of them want it, which is why the price of the metal is at a low point. Think spread, not price. Think about what this inverted spread is saying. Despite the cost to carry silver, it is cheaper to buy silver for delivery in September than it is now.
You could lock in the price now, and not have to come up with the money for a few months. But you would not have to pay interest on this deal, no you will be given a discount. Few people appreciate the significance of this. Only a tree surgeon would recognize the rot in the heart of a treat.
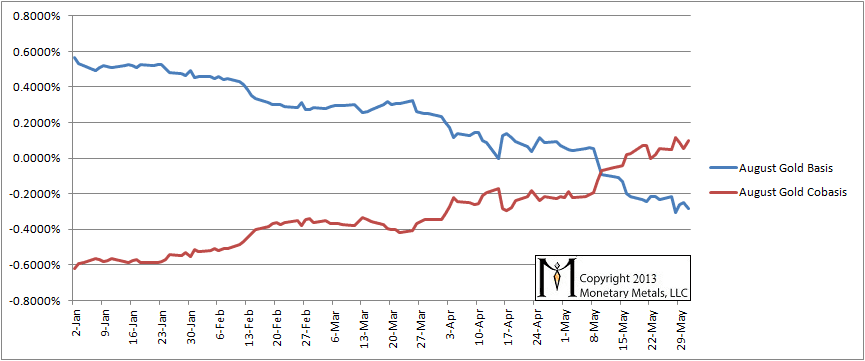
The August basis continues to fall, and cobasis continues to rise. It is above zero—backwardation—though not by much yet.
Gold Basis and Cobasis
Here is the basis chart for July and September silver. The contract roll is underway so we will show September as well and soon drop July.
Silver Basis and Cobasis
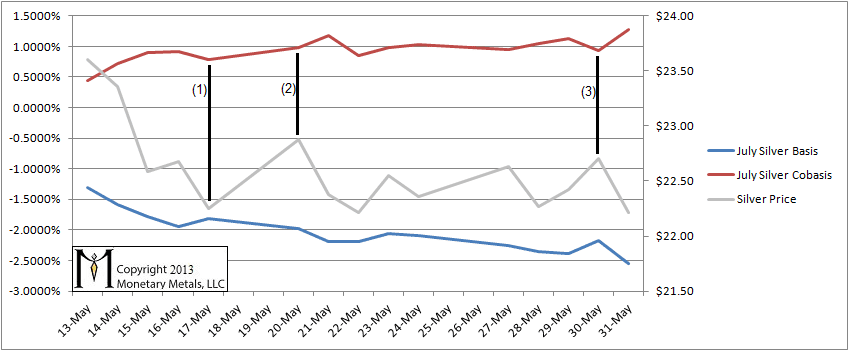
Above, we said we would take a look at what the basis can and cannot predict. In general, the basis is not well suited to rapid trading. Below is a graph of the last few weeks, showing the July basis and cobasis overlaid with the silver price. Three separate dates are labeled and each illustrates a point.
- The day prior to this point, we see silver become a bit less scarce. The price drops a bit. This would have been tough to trade.
- The price rises with no particular advance signal. This was not tradable.
- The most salient feature on this graph is the headfake on Thursday. The price blipped to over $23 intraday. By the close on Friday, it was down around $22.20. The basis rose and the cobasis fell. You don’t always get obvious signals that a price move is likely to be reversed.
Silver Headfake
It should be underscored that the challenge of trading this market is that the massive forces buffeting around the gold and silver prices are coming from the currency and credit markets.
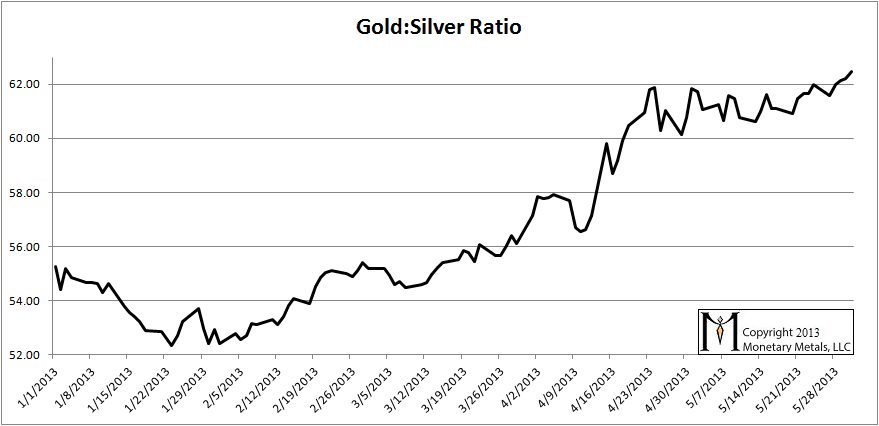
Finally, here is the graph showing the ratio of gold to silver. It moved up further to a new high. We reiterate that we are cautious about the price of silver (measured in grams of gold) and think the ratio is more likely to rise than to fall. Should something precipitous occur in Japan, this ratio could spike to an astonishing height.
Gold to Silver Ratio
Not rotting, rottEN.
Stop making excuses, it’s a Ponzi scheme, completely irrational, & you & I both have no idea when it the tree will finally fall.
Excuses? Can I recommend that you read some of my papers, such as my ongoing series on the theory of interest and prices under an irredeemable currency (on my personal blog keithweinereconomics.com)?
Love the blog. Thanks for sharing the insights. I’m learning a lot!