
Monetary Metals Supply and Demand Report: June 9, 2013
The Last Contango Basis Report
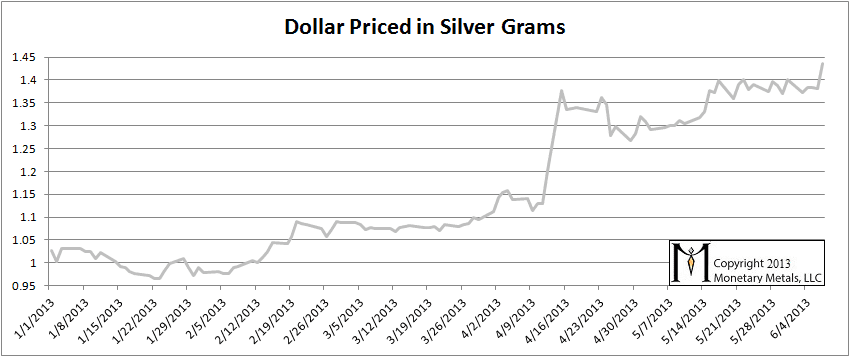
To dollar thinkers, it looks like gold and especially silver got whacked this week. To those calculating their net worth in silver (if any exist today), this is how it looks.
The dollar went up to a new high for the move. It would seem that the pressures squeezing debtors overcame the pressure emanating outward from Bernankeville this week (here is our theory). The pain of the gold bugs continued. And the silver bugs.
One cannot truly understand the gold market in terms of the quantity of dollars, price charts, or by charts of open interest, ETF holdings, etc. (look for our article this week on COMEX inventories).
One must study the gold basis (see here for a basic explanation). Think of the basis as a scarcity indicator. Since gold and silver have huge inventories that are not consumed—they are held for monetary purposes—a sign of scarcity in the market is a sign that the dollar is moving towards collapse, when gold will no longer bid on it.
The positive basis, i.e. contango is disappearing (hence the name of this report). This is a process of gold withdrawing its bid on the dollar. One cannot understand this if one lives in the dollar bubble, looking at the gold “price” as if it were comparable to the price of Apple shares or crude oil.
The “bull market” in gold and silver is not over. We do not recommend that anyone sell his gold now, unless he is using leverage (and we don’t recommend using leverage). When the gold price rises, we don’t recommend selling then, either. A rising gold price gives only an illusion of profit (and the tax man will take a big piece of that).
In this report, we have been tracking the temporary backwardation in both metals. It is like a distortion field, as we move closer to each futures contract expiry, that contract is pulled into backwardation. The distortion field is wider for silver than gold. The bid drops, which causes the basis to fall off the bottom of the chart. This could be due to heavy selling, as naked longs must sell before First Notice Day (since they haven’t got the cash to buy the metal). This selling must be on the bid, which would press it.
But this does not fully explain the phenomenon. The basis for September silver has been falling in earnest since shortly after the April 15 crash. This is commensurate with a theory of rising scarcity at the lower price, rather than merely reflecting the mechanics of the contract roll.
It is not just that the basis is falling. The cobasis tends to rise at the same time. In last week’s Report, we noted that the cobasis for September silver was positive—backwardation. It ended this Friday at zero; it is not backwardated at the moment, but we shall see what next week brings.
Think of this as rot in the heart of a tree. It can spread for years, undermining its integrity. The collapse of the tree at the end is “unexpected”. The financial system is rotting. People are increasingly discounting monetary metals for future delivery. When they want it, they want it now. At the moment, not that many of them want it, which is why the price of the metal is at a low point. Think spread, not price. Think about what this inverted spread is saying. Despite the cost to carry gold, it is cheaper to buy gold for delivery in August than it is now.
You could lock in the price now, and not have to come up with the money for a few months. But you would not have to pay interest on this deal. Instead, you will be given a discount. Few people appreciate the significance of this. Just as only a tree surgeon would recognize the rot in the heart of a tree.
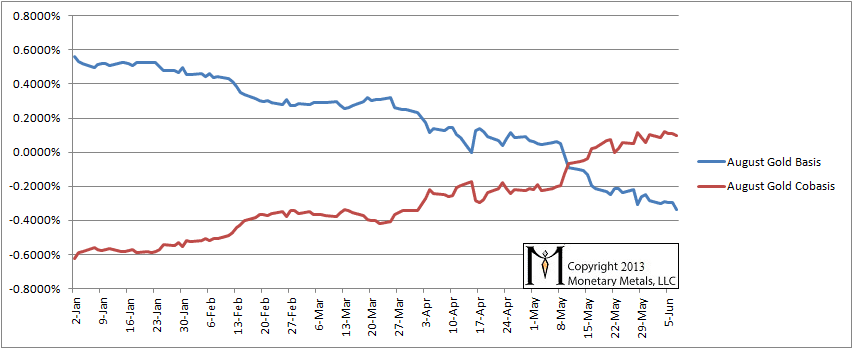
The August basis continues to fall, and cobasis went sideways. This is interesting (and not bullish for the price), that despite a big drop the cobasis did not rise.
Gold Basis and Cobasis
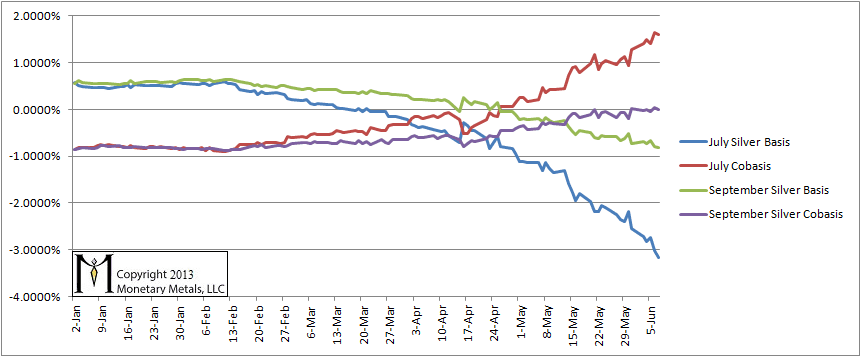
Here is the basis chart for July and September silver. The contract roll is underway so we will show September as well and soon drop July. The July contract is under heavy selling pressure due to the mechanics of the roll, and so its cobasis continued to rise (though interestingly, perhaps tellingly, not on Friday when the price dropped sharply). The cobasis for September, in contrast, did not.
Silver Basis and Cobasis
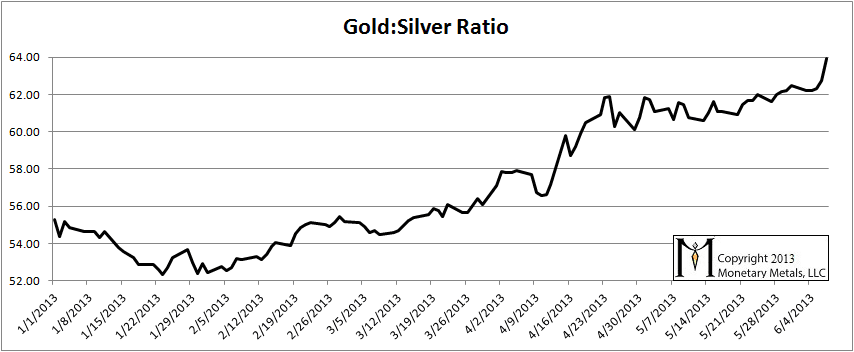
Finally, here is the graph showing the ratio of gold to silver. It moved up further to a new high again this week, just a hair under 64. In January, we explained why the ratio would rise. Our prediction (in a video and articles) was for the ratio to reach at least 60 and maybe 70. At the time, the ratio was 52. We are two thirds of the way there now, and not reversing our call yet. Should something precipitous occur in Japan, this ratio could spike to an astonishing height.
Gold to Silver Ratio
Keith, Do you think the price of paper Silver and Gold will first go to $0 before it goes to the senario where no one will trade dollars for the physical monetary-metals?
Live well
Thanks for your question thinkpeace.
I should really write up my thoughts on the transition process to permanent backwardation. I could not do it justice in a comment. ;)
Keith, I hear you and look forward to your thoughts on the transition.
You are appreciated!
Keith, I would love to read them, the sooner the better. Many thanks!