
Monetary Metals Supply and Demand Report: 10 May, 2015
The prices of the metals rose a little this holiday (in the UK) week. The phrase, “like watching paint dry,” comes to mind. We will keep it brief this time, though we have one observation to offer.
Every dollar-thinking trader in the market is thinking the other traders should begin buying. What are China’s true gold holdings? What about the discussions of banning paper cash? Wouldn’t that encourage people to buy gold?
Any of these things might be the catalyst for higher gold prices. And traders who bought ahead of them would have profits… or would they? Gold would exchange for more dollars, but in a world where people are repudiating dollars, is this more wealth?
These are some questions that cannot be answered in this Report. What we can answer is simply this: what is the true state of supply and demand fundamentals? Did it change this week?
Read for the only accurate picture of the monetary metals markets…
First, here is the graph of the metals’ prices.
The Prices of Gold and Silver
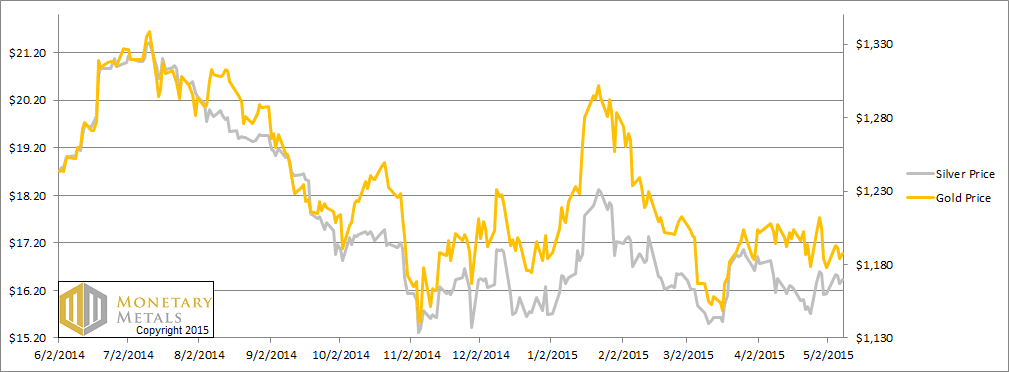
We are interested in the changing equilibrium created when some market participants are accumulating hoards and others are dishoarding. Of course, what makes it exciting is that speculators can (temporarily) exaggerate or fight against the trend. The speculators are often acting on rumors, technical analysis, or partial data about flows into or out of one corner of the market. That kind of information can’t tell them whether the globe, on net, is hoarding or dishoarding.
One could point out that gold does not, on net, go into or out of anything. Yes, that is true. But it can come out of hoards and into carry trades. That is what we study. The gold basis tells us about this dynamic.
Conventional techniques for analyzing supply and demand are inapplicable to gold and silver, because the monetary metals have such high inventories. In normal commodities, inventories divided by annual production (stocks to flows) can be measured in months. The world just does not keep much inventory in wheat or oil.
With gold and silver, stocks to flows is measured in decades. Every ounce of those massive stockpiles is potential supply. Everyone on the planet is potential demand. At the right price, and under the right conditions. Looking at incremental changes in mine output or electronic manufacturing is not helpful to predict the future prices of the metals. For an introduction and guide to our concepts and theory, click here.
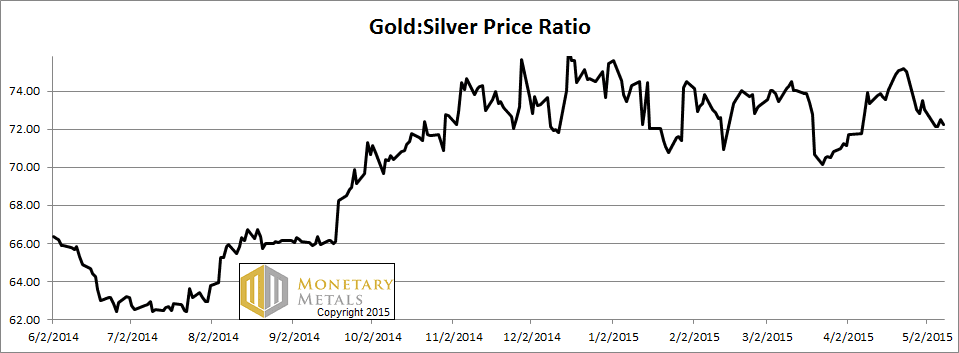
Next, this is a graph of the gold price measured in silver, otherwise known as the gold to silver ratio. It moved down this week.
The Ratio of the Gold Price to the Silver Price
For each metal, we will look at a graph of the basis and cobasis overlaid with the price of the dollar in terms of the respective metal. It will make it easier to provide brief commentary. The dollar will be represented in green, the basis in blue and cobasis in red.
Here is the gold graph.
The Gold Basis and Cobasis and the Dollar Price
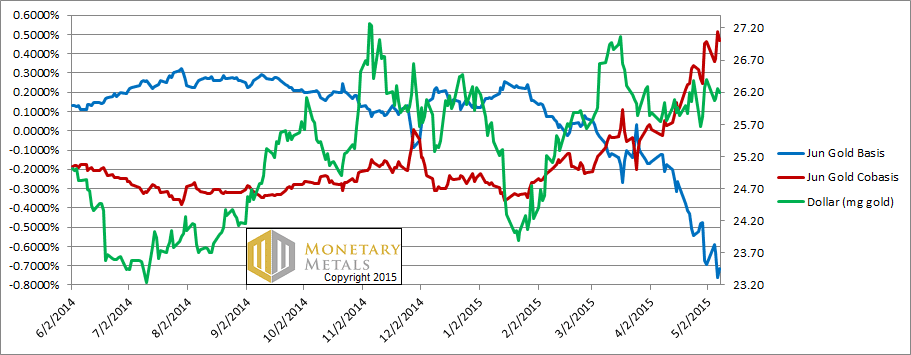
The June cobasis (i.e. scarcity) is up some more, even as the price of gold is up. However, this is not true for farther-out contracts. We are seeing the effects of the contract roll, as traders are selling June and buying August.
The fundamental price fell a few dollars but is still well above the market price.
Now let’s look at silver.
The Silver Basis and Cobasis and the Dollar Price
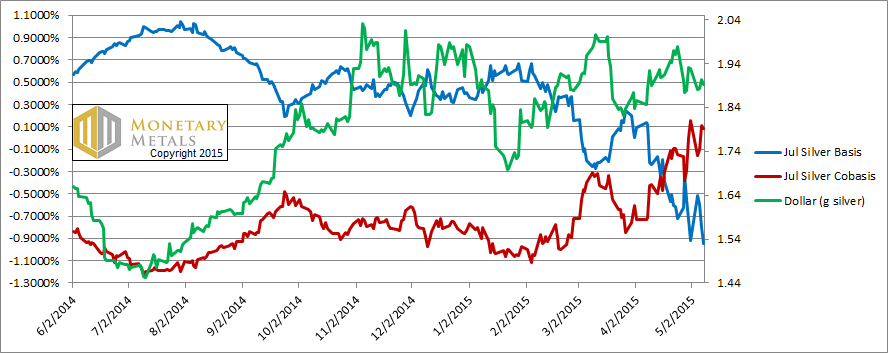
In silver, the cobasis ended down on the week, which is what we would expect. As the price goes up, the metal becomes less scarce and more abundant (i.e. rising basis) in the market.
We calculate a fundamental price almost a buck below the market price.
© 2015 Monetary Metals
Leave a Reply
Want to join the discussion?Feel free to contribute!