
Monetary Metals Supply and Demand Report 9 August, 2015
Last week, we left off with this.
“Something is happening with gold…”
It began in Dec 2008. To understand it, it is necessary to understand two principles. The first is that gold is money and the dollar is credit, which currently has nontrivial value. A dollar is worth 28.4mg gold. To understand the second, let’s look at how markets work at the mechanical level.
Regular readers of this Report know that we emphasize the bid and ask prices as separate values. The people and forces involved in the bid price are different from those involved in the ask price. This is critical in our definition and calculation of the basis and cobasis. You cannot just assume that there is a real price, somewhere between the bid and ask. That may be a working approximation during normal market conditions. But it could be badly misleading.
Suppose there is stress in the market, a crisis impending or active. The bid recedes, and can even withdraw entirely. For example, what if the US Geological Survey were to say that there will be an earthquake in Los Angeles, 15 on the Richter scale, and nothing taller than a dollhouse will be left standing? You would not find any lack of offers to sell real estate. But what is the price of a house in LA? There wouldn’t be a bid in LA, and maybe not as far south as Chile, as far north as British Columba, and as far east as the Mississippi River. The bid would come back into the market when the threat was over (perhaps at a much lower level).
The second principle is that gold is not offered for dollars, despite what you see on any quote board. Gold is bidding on the dollar. It is comforting to assume it will always be so, that the only question is price. This is an illusion, based on unwarranted faith and the assumption—or hope—that things will continue as they currently are.
Even gold bugs accept this. They ask when gold will hit $5,000 or $10,000 or whatever price level. It may not. It may go off the board first. We don’t know what the final quote will be, but we do know that there will be one.
What’s been happening since 2008? The process of withdrawing the gold bid on the dollar has begun. There are intermittent episodes where we can see it in miniature. Of course, we’re referring to backwardation in gold and silver futures. Gold backwardation should not be possible, and yet it is occurring. So far, it’s only in small amounts and only for near contracts (not counting the episode in silver which extended out years)—what we call temporary backwardation.
Right now, the October and December gold contracts are backwardated. These backwardations, like all of them in the past 7 years, are small. At the moment, they’re less than a dollar an ounce. This is not something you can see by using typical end-of-day quotes. You need a sensitive and precise instrument, which is what Monetary metals has built.
It’s part of why we have continued to say that the market price of gold is far below the fundamental price.
Speaking of price, not much happened with the gold price this week, though there were a few $14 round trips. The price of gold ended a buck lower than last week. The price of silver did drop to $14.37 after hours on Monday. It ended the week up four cents. The true action was not seen in the price, but in the basis.
Read on for the only accurate picture of the supply and demand conditions in the gold and silver markets, based on the basis and cobasis.
First, here is the graph of the metals’ prices.
The Prices of Gold and Silver
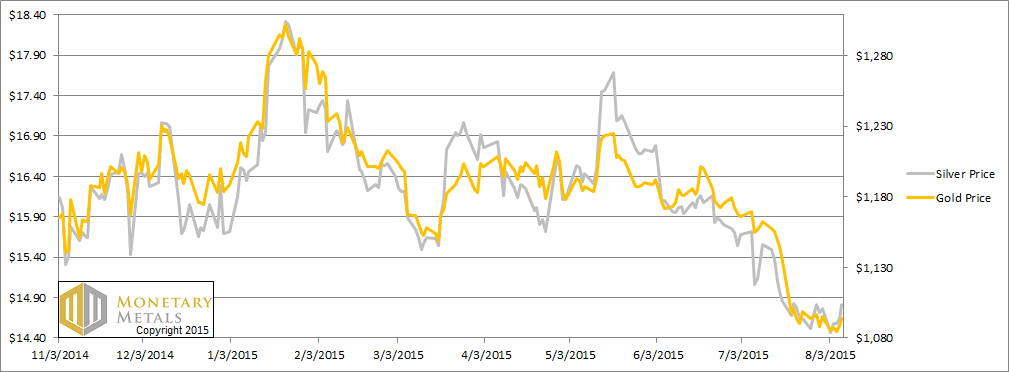
We are interested in the changing equilibrium created when some market participants are accumulating hoards and others are dishoarding. Of course, what makes it exciting is that speculators can (temporarily) exaggerate or fight against the trend. The speculators are often acting on rumors, technical analysis, or partial data about flows into or out of one corner of the market. That kind of information can’t tell them whether the globe, on net, is hoarding or dishoarding.
One could point out that gold does not, on net, go into or out of anything. Yes, that is true. But it can come out of hoards and into carry trades. That is what we study. The gold basis tells us about this dynamic.
Conventional techniques for analyzing supply and demand are inapplicable to gold and silver, because the monetary metals have such high inventories. In normal commodities, inventories divided by annual production (stocks to flows) can be measured in months. The world just does not keep much inventory in wheat or oil.
With gold and silver, stocks to flows is measured in decades. Every ounce of those massive stockpiles is potential supply. Everyone on the planet is potential demand. At the right price, and under the right conditions. Looking at incremental changes in mine output or electronic manufacturing is not helpful to predict the future prices of the metals. For an introduction and guide to our concepts and theory, click here.
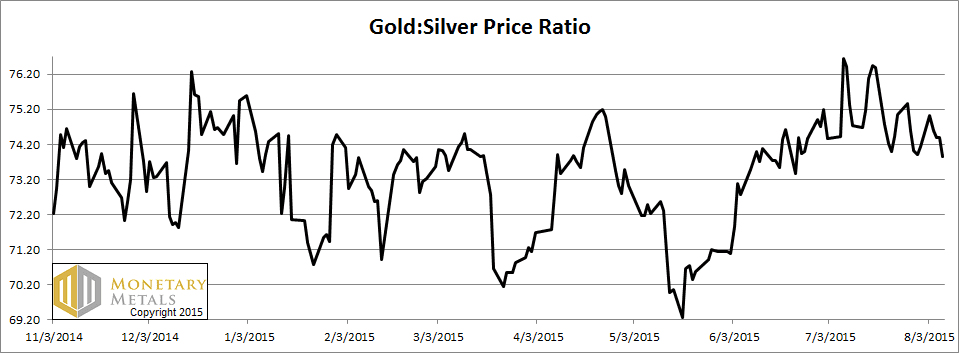
Next, this is a graph of the gold price measured in silver, otherwise known as the gold to silver ratio. The ratio moved down this week.
The Ratio of the Gold Price to the Silver Price
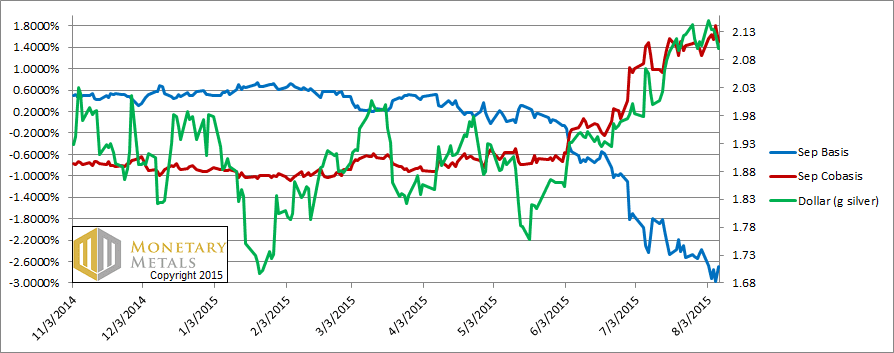
For each metal, we will look at a graph of the basis and cobasis overlaid with the price of the dollar in terms of the respective metal. It will make it easier to provide brief commentary. The dollar will be represented in green, the basis in blue and cobasis in red.
Here is the gold graph.
The Gold Basis and Cobasis and the Dollar Price
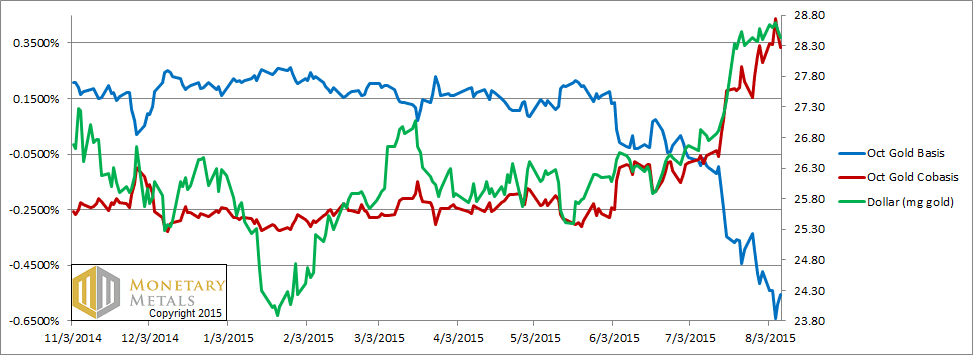
The price of the dollar rose a bit more (i.e. the price of gold fell). Again, along with this price move, the scarcity of gold rose a bit.
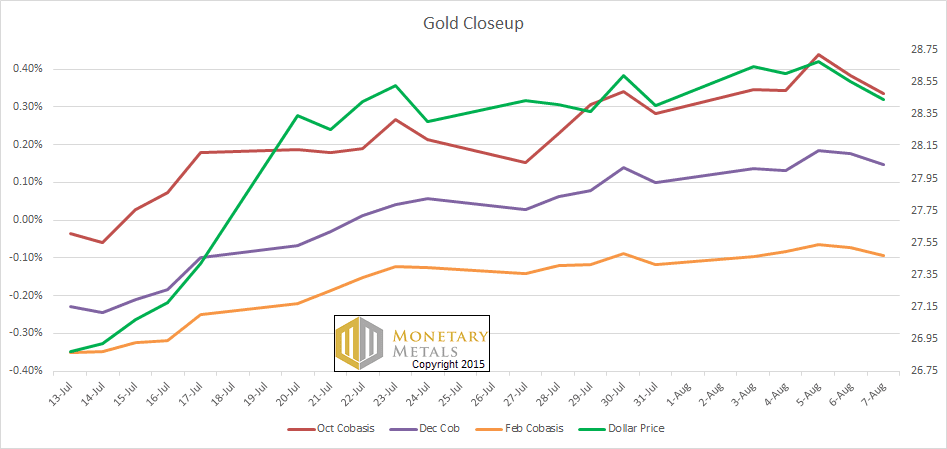
Let’s zoom into the past month, and look at not just the October cobasis, but also the December and February. You can see how the dollar correlates with these three cobases. Notice that February is close to the zero line (i.e. backwardation) but no cigar yet.
Closeup of Gold
Now let’s look at silver.
The Silver Basis and Cobasis and the Dollar Price
The silver price is up a bit (i.e. the price of the dollar, as measured in silver, is down). There was a sharp drop in scarcity on Friday. And a dramatic drop in the December cobasis as well, it is lower this week than last.
The fundamental price of gold is still about a hundred bucks over the market. And in silver, it’s about 20 cents under. The price spike at 6am (Arizona time) on Friday was justified in gold, but not in silver.
© 2015 Monetary Metals
Keith, what has caused people fundamentally to sell gold and bid for dollars over the past four to five years. Why is the price $1,080 today vs. $1,500 or $500. What fundamental factors set the price of gold relative to dollars? In other words, any advice as to what to look at to understand the supply/demand factors–credit spreads, etc.
Hi Keith, It would help me to interpret your price chart if you were to note that equality in the gold-silver price curves corresponds to a 71.5 ratio. Is there anything special about that particular ratio?
johnchew: What has caused the dollar to rise? In short, debtors are feeling the squeeze.
atherczar: What do you mean equality in the curves?
The lines in the dollar price chart are scaled such that at a 71.5:1 ratio of the gold:silver price in dollars, the lines cross. So if the gold line is above silver line, the ratio is higher than 71.5:1. I was just curious if that was a particular ratio of interest in your modelling.
Keith, I have a question. What is behind scarcity on the market in your opinion? I mean that if market offers you profit opportunity why market makers do not use it? Do they have no counterpart who could borrow them phys. gold for reasonable price? If so than backwardation is some sort of proof that market makers don´t break rules in the meaning that they do not use gold otherwise than clients allow them. Neither central bankers do not lend phys. gold on the market? or it could be something else, e.g. ability to deliver phys. in future ?
Second if there is no one who is able to borrow you gold for reasonable price to make arbitrage than on the other hand must be some entities who are pushing down bid on futures market – are these some naked contracts or what is behind their strategy? thnx
Keith,
Your example of an LA earthquake prediction makes a great illustration of the essence of the “bid withdrawal” argument! Bid withdrawal is an Austrian-method reason to believe that gold can go into backwardation vs any given futures contract, and that this bodes ill for dollar liquidity.
Can the argument be extended to say that the October contract is backwardated relative to the December one? I.e., is it possible to make a return by “de-carrying” October paper in favor of December paper? Clearly that isn’t safe as a “naked” trade, but would it be a way to earn a dollar return on gold that never even leaves your possession until October (if you then choose to allow that!). An Oct-Dec decarry arbitrage is thus an option on whether gold will be more or less backwardated come late September. If it’s less backward you can let it “expire” by buying spot-then to make delivery and then taking December delivery of the gold component of your profit.
… and one edit of your Geekish: Make it 10 on the Richter scale.
15 would be the equivalent of 1 petaton of TNT.
For comparison, the asteroid impact (Yucatan Peninsula 65M BCE), thought to have driven dinosaurs and much else into extinction, is estimated at 13 on the Richter scale (it’s logarithmic!).
Keith,
The earthquake analogy you used is so apropos, but to make it parallel the current pecuniary situation, you would have to change the scenario to where after the US Geological Survey alerted everyone to the impending doom, everyone choose to bury their head in the sand and ignore the scientific facts as quackery and have complete faith in Government and the pertinent Geological cartel to keep things humming along with no problems. Those who heed the undeniable scientific evidence would be considered paranoid delusional quake-bugs!
The math is the math, and math is an exact science!
matus: When gold metal gets tight, it affects the lease rate as well as the cobasis. What’s the cause? Sounds like a good topic for next week! ;)
Greg: Going short October and long December loses money as of the moment I am writing this. There’s a few pennies to go long October and short December, but I would doubt any trader would find it worthwhile.
Thanks for the info on the Richter Scale. I knew 15 was bad, but didn’t realize it would be worse than a major asteroid strike! :)