
What Causes Loss of Purchasing Power, Report 7 Apr

We have written much about the notion of inflation. We don’t want to rehash our many previous points, but to look at the idea of purchasing power from a new angle. Purchasing power is assumed to be intrinsic to the currency. We have said that the problem with the word inflation is that it treats two different phenomena as if they are the same. One is the presumed effect of rising quantity of dollars. The other is the effect of rising regulatory and tax burdens.
Let’s use milk as an example. Suppose milk was $1 per gallon. Many would say that a dollar is worth one gallon of milk. Or, alternatively, a dollar’s purchasing power is one gallon of milk. Suppose that later, the price of milk goes up to $2. Then, people say that the dollar’s purchasing power falls by 50%, to half a gallon of milk. Regardless of what you call it, everyone would agree that the dollar buys less than it did.
Until now. Let us explain.
One can think of production as buying a bunch of ingredients, and mixing them together in a certain way, to create the product. For example, milk comes from the ingredients of: land, cows, ranch labor, dairy labor, dairy capital equipment, distribution labor, distribution capital, and consumable containers.
Now suppose—this is purely hypothetical and could never happen in the real world—the government enacted a regulation. Dairy farmers are required to tag every cow. This adds some new ingredients to the milk product: consumable tags, tag labor, and tag capital equipment
Next, the government decides that it wants dairy farmers to pay for its costs to inspect the tags and audit the tag tracking records. Add government inspector labor to the list of ingredients.
Regulation after regulation is passed, controlling the use of land, the number and treatment of the cows, the workers, etc. etc. By the time all’s said and all’s done, the cost to produce a gallon of milk is ten times higher.
Of course, the retail price of milk is not directly connected to the cost of producing it. If you doubt this, then maybe you will go out and buy a new BMW 750 and then tell your boss that now your cost of living is higher, and therefore your wage must go up! In all seriousness if milk producers could charge more, then they would already be charging more. A rising cost of production is the producer’s problem.
However, no one can sell at a loss for long. So what happens in reality is that producers try to raise their prices. Some consumers are unable to buy milk at the higher price. Others are unwilling. The marginal milk buyer stops buying milk, and may switch to a substitute. The net result is the bankruptcy of some dairy producers, a decline in quantity of milk purchased by consumers—and much higher prices.
In our example, the cost to produce went up by 10X. The price to buy milk will likely end up close to that (there are other variables that can affect price in a real economy, of course).
In this light, we can see that it is not right to say that the dollar’s purchasing power went down 90%. The dollar is paying for just as much as it did, previously. It’s just that the things it buys are increasingly not the things that consumers care about (or even know about). Things like supersized Americans With Disabilities bathrooms for dairy workers, extra motel stays for milk truck drivers due to mandatory stops, forced vitamin D addition, special plastic jugs, taxes, fees, permits, licenses, etc.
A lot of labor and capital goes into all this government-mandated stuff. If we look at each of them as an additional ingredient that is now necessary to produce milk, we can see that it’s not that the dollar went down. It’s that more ingredients went into the milk. Milk really went up.
There are four points we hope that readers will take home from this. First, the term purchasing power suggests something that is untrue. It suggest that the quantity of milk that can be bought for a dollar is intrinsic to the dollar, and has nothing to do with what goes into producing milk. Two, whatever the word for forcing milk producers to add more and more useless ingredients may be, that word should not be the same as the one that refers to monetary debasement. Three, people should demand the repeal of laws that force milk producers, and car producers, and home producers, and every other kind of producer, to add ingredients that increase the cost without increasing the value. And four, the Federal Reserve deserves the blame for many ills, but this is not one of them.
Add this to the list of reasons why the dollar cannot be measured in consumer prices, why it is not proper to say that a dollar is worth one tenth of a gallon of milk.
Supply and Demand Fundamentals
If you read gold analysis much, you will come across two ideas. One, inflation so-called (rising consumer prices) is not only running much higher than the official statistic, but is about to really start skyrocketing. Two buy gold because gold will hedge it. That is, the price of gold will go up as fast, or faster, than the price of consumer goods.
Well, consumer prices are not rising as a consequence of monetary policy. If they’re rising, it’s despite the falling interest rate, and due to the government constantly forcing producers to add more and more ingredients to the production of everything.
So why would we expect the price of gold to rise to match the never-ending addition of compliance costs to milk and cars and petrol and pharmaceuticals?
In the short term, speculators can bid up the price of gold in response to a rumor of inflation, of de-dollarization of an economy, of Fed policy changes, etc. But sooner or later, if that’s all it is—speculators front-running a rumor—the price will quickly revert. In a long-term graph, the blip will disappear into the noise.
In the long term, the price of gold will move as the people (not merely leveraged speculators amped up on the latest Internet rumor) perceive that the dollar’s demise draws near. Or as gold’s utility grows, after an 85-year government-imposed hiatus.
Both trends are marching forward. In order to achieve this post-2008 boom, central banks have pumped out enormous amounts of credit in every currency. How much? We came across this graph that illustrates the problem in a space not typically analyzed: small-cap stocks.
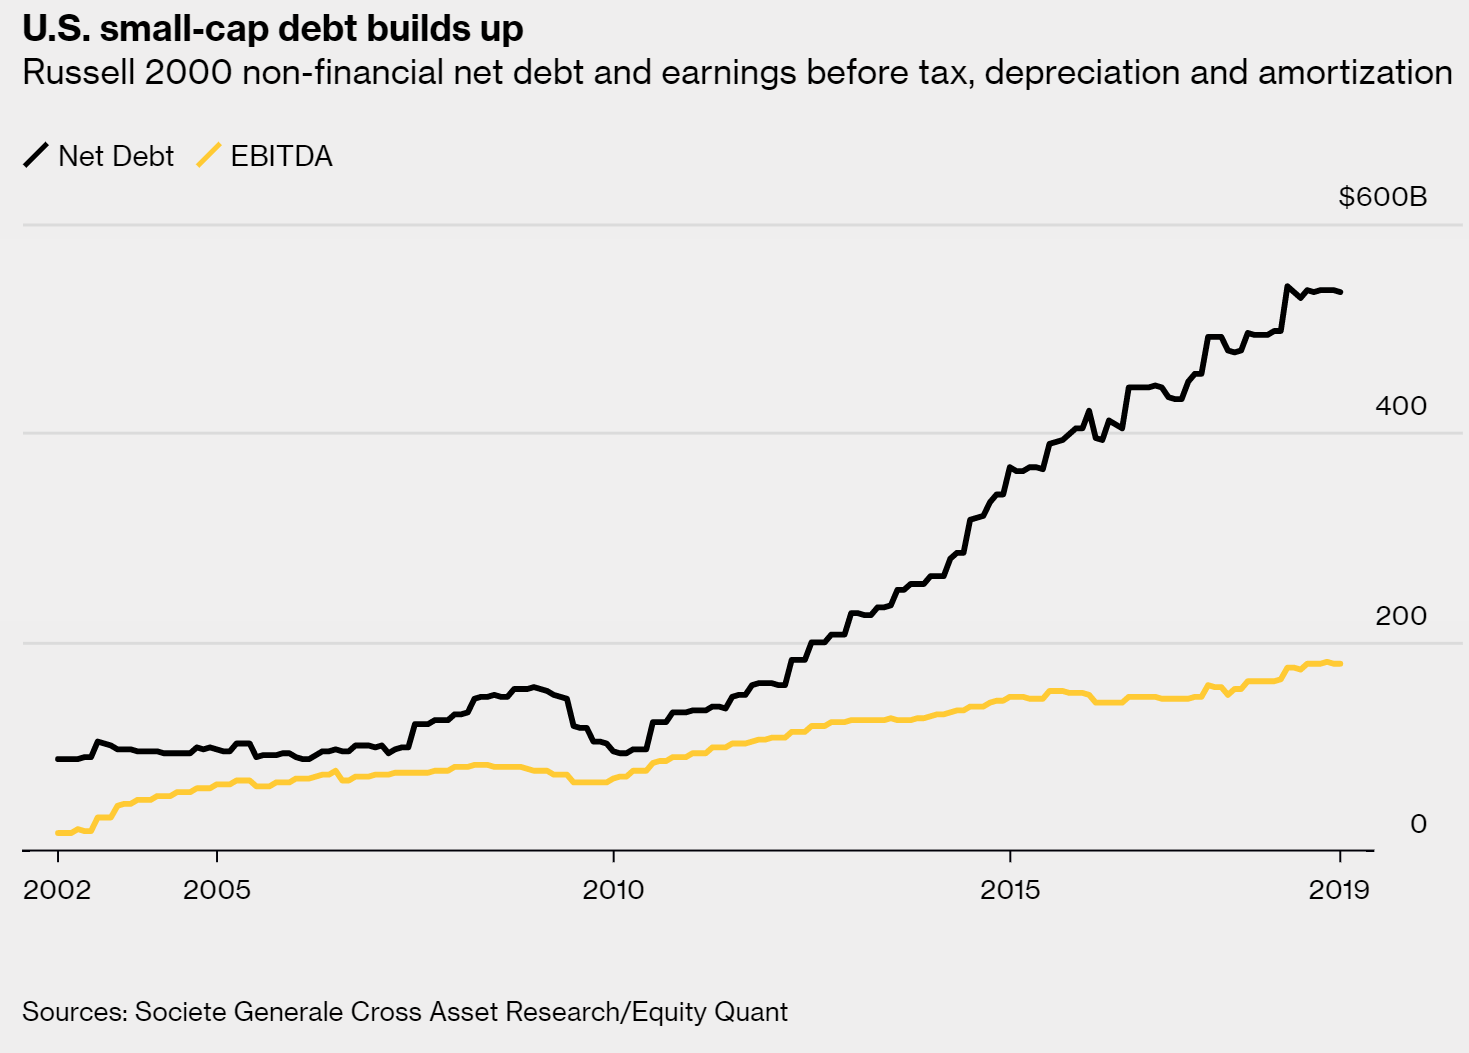
Look at the incredible growth of debt and the modest growth of earnings. From the peak in 2008 until now, earnings grew by 120%. But the debt that finances these earnings grew by 264%. That is a big increase in leverage. Or, alternatively, we might say that these 2000 companies are consuming their investors’ capital.
To put this in perspective, in 11 years these companies collectively added $387B in debt. But they grew earnings by only $98B. The marginal productivity of this debt—here used to mean change in EBITDA per dollar of added debt—is $0.25. This not only makes these companies more brittle, more vulnerable to a downturn.
But, there is another problem. Each one’s added debt comes to other companies (including many Russell 2000 companies) as revenues. This means that when credit tightens again, revenues will drop as a direct consequence of one firm’s cessation of borrowing to buy the products of another (or pay its employees’ salaries, which are spend on the products of another).
There is a synergistic effect at work here. It’s great fun on the way up (and politicians all around the world love to take credit for it). And it will be great pain on the way down.
The prices of the metals were all but unchanged this week. Perhaps a great April Fool’s joke was played by The Cartel?
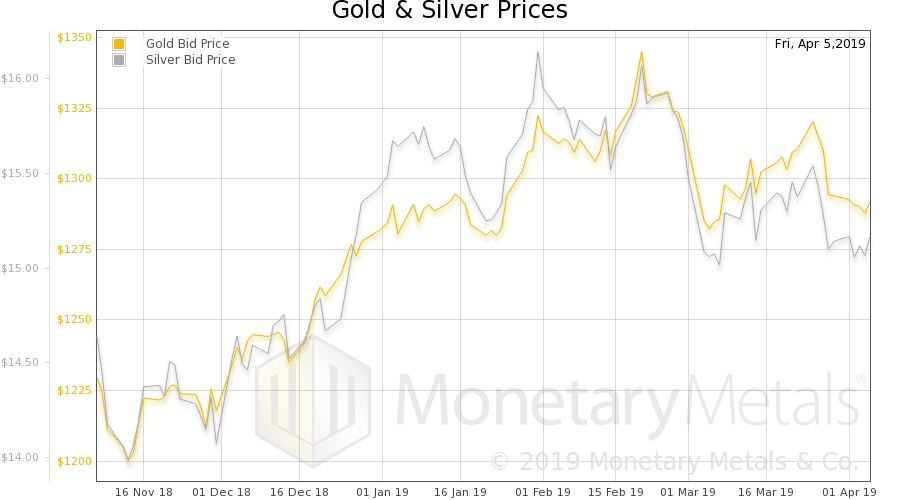
Anyways, let’s look at the only true picture of the supply and demand fundamentals of gold and silver. But, first, here is the chart of the prices of gold and silver.
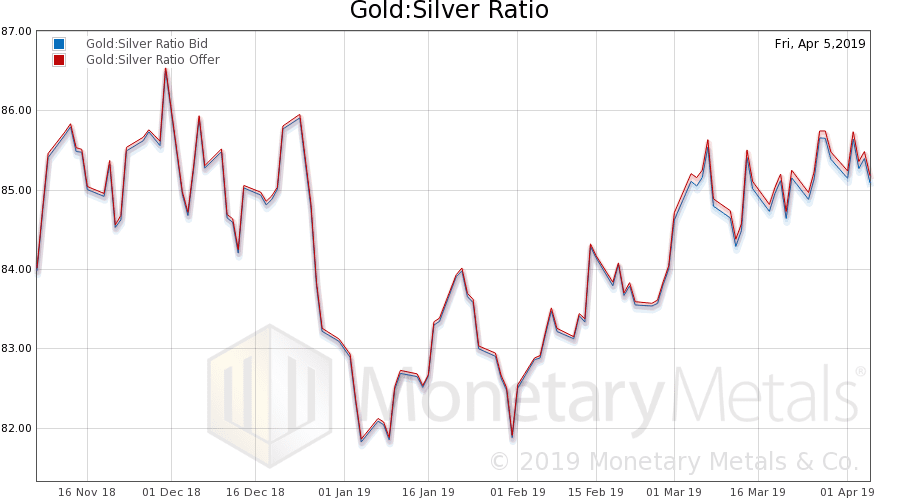
Next, this is a graph of the gold price measured in silver, otherwise known as the gold to silver ratio (see here for an explanation of bid and offer prices for the ratio).
Here is the gold graph showing gold basis, cobasis and the price of the dollar in terms of gold price.
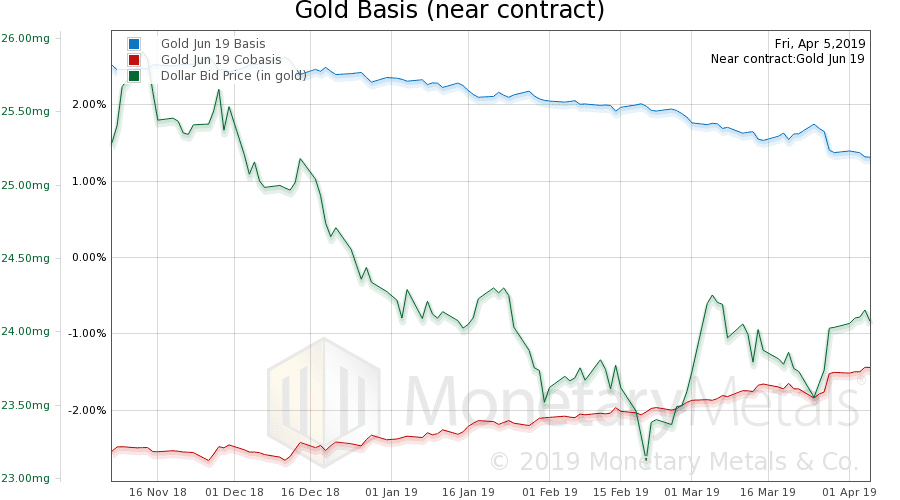
The scarcity (i.e. cobasis) as measured by the June contract rise a bit. However, the gold basis continuous dropped a bit. So this week there was some selling of metal and buying of futures.
The Monetary Metals Gold Fundamental Price dropped quite a bit, to $1,456.
Now let’s look at silver.
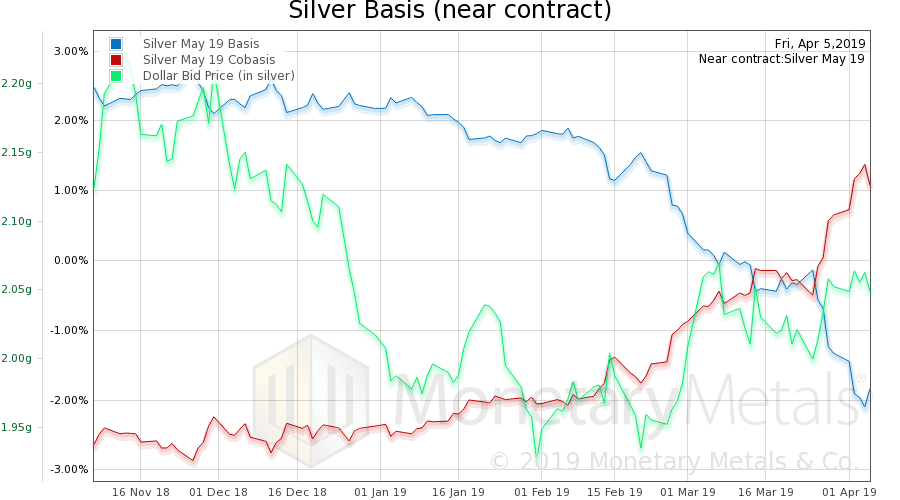
The temporary backwardation in the May contract increased to over 1%. However, the silver basis continuous shows a move in the opposite direction.
And the Monetary Metals Silver Fundamental Price was down 11 cents to $16.18.
© 2019 Monetary Metals


Thanks for the article, Keith,
Another way to look at the problem is with orders of production. As the production of a good becomes more capital intensive, the number of steps involved, or orders of production, grows. In the normal case, each order of production is productive. However, in the case of regulations on milk production, these additional orders are unproductive.
Regarding the what-a-dollar-is-worth question, recall that the dollar serves in this case as a medium of exchange–1 gal. milk = usd1. On the left side of the equation, a bunch of unproductive activities are attached to the gallon of milk; cost of production rises. So, it helps to identify which side of the equation is changing. Yet, this is difficult to do without careful analysis.
Inflation really is a meaningless, garbage word. Thanks for pointing that out.
Shouldn’t purchasing power, if it is to be measured at all, be measured in ounces of gold instead of USD? Then we can say something objective about gold as a store of value and also about whether it is increased cost of production due to regulation, or decreased cost of credit, that is causing some price (measured in gold) to rise. It seems like extra costs in production should also show up in the gold price.
Looking at the reigning “king of commodities”, crude oil, who’s cost as an input to production is reflected in most other goods, we see that the gold price of crude since the Nixon default is a big nothingburger. Does that mean crude mining regulations remain static over time? Or at lease increase slow enough to be offset by mining productivity gains? I don’t know the whole story, but at least we can say gold has been as good a store of value as its “black gold” cousin.
I am heading out right now to get me 6 x 44gallon drums of Oil.
Not sure what I will do with it though.
You mentioned the need for a word to cover the regulatory costs added to products, I think there may be one already: “regulatory burden”. An interesting pair of graphs would display the components of price into production costs and regulatory burden, and a second graph showing the regulatory burden costs additive through already burdened components – having that visually displayed might prove effective in showing how regulation ‘burdens’ an economy.
Upon further reflection, the financial burden of regulations may show up as a type of one-time step up in cost as of the implementation date. After the initial increase in costs due to the new regulations, the long-term price trend could be assumed to continue, but only at a higher price level. An econometric study could reveal any regime changes or breaks in price that other variables do not account for.
Secondly, cost does not necessarily equal price. An empirical study of elasticities and market power could reveal which party, the buyer or the seller, is absorbing the increased cost.
Thus, the questions of what is the cause of and what is the timing of an increase in prices, regulations or monetary expansion, is an empirical one, and probably quite complex. Prices, therefore, may not be such a bad indicator of “price inflation” after all. This would have to be tested, though.