
Monetary Metals Supply and Demand Report: 14 June, 2015
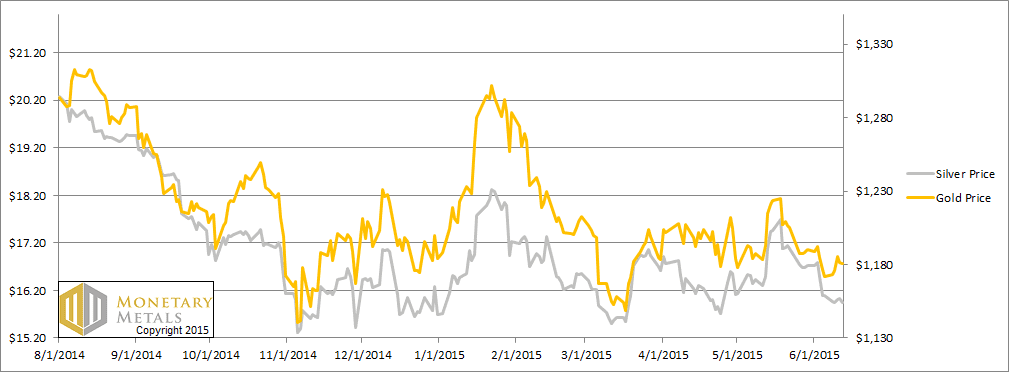
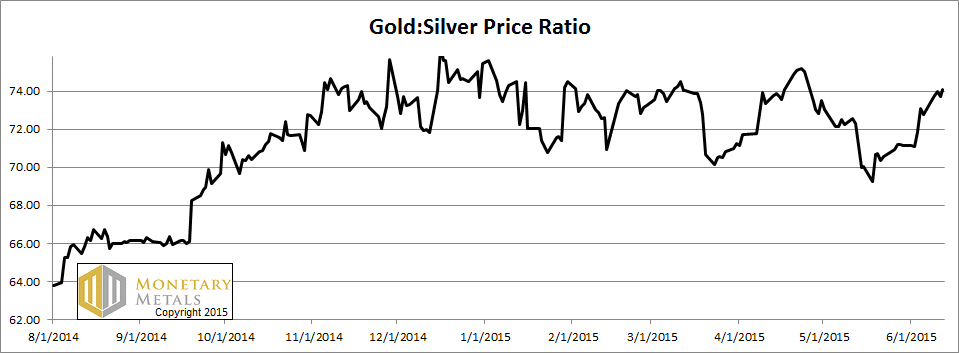
The price of gold was up $9 this week, while the price of silver dropped 16 cents. This means the gold to silver ratio (a measure of how expensive gold is in silver terms) rose 1.3 points or almost 1.8%. This is a picture of credit contraction writ small. Well, it’s small so far.
Since February, the interest rate on the 10-year Treasury bond has been in a correction to its three decades long trend. It has moved sharply higher from under 1.7% to just under 2.5% this week. That’s what credit expansion looks like. People sold the Treasury bond, to buy riskier assets with higher yields. It is interesting that junk bond yields did not rise in proportion to Treasury yields.
Silver has two characteristics. It is a more speculative asset than gold, and thus bought more in a “risk on” environment than gold. It’s also a monetary metal, which tends to be bought when financial assets are sold. The silver price moved down in February, then up sideways from February and into mid-March. Then it recovered sharply through the end of March, then down through most of April, then recovered through mid-May. It’s been down since.
The whole time, we have maintained a negative outlook on silver. We have been tracking a fundamental price of silver from the high $14’s to the high $15’s, and always a dollar or two below the market price. Speculators can support a stretched price for a long time, and indeed they have. So the question is: what could drive them to let go, and stop holding the price a buck or so above market? What could even make the market price drop below its fundamental (as gold has been for a while)?
Credit contraction. Remember 2008?
Did we mention that the S&P 500 index fell this week? As did junk bonds. We shall see if these are new trends that continue.
Read on, for a picture of how incipient credit contraction is affecting the supply and demand of gold and silver.
First, here is the graph of the metals’ prices.
The Prices of Gold and Silver
We are interested in the changing equilibrium created when some market participants are accumulating hoards and others are dishoarding. Of course, what makes it exciting is that speculators can (temporarily) exaggerate or fight against the trend. The speculators are often acting on rumors, technical analysis, or partial data about flows into or out of one corner of the market. That kind of information can’t tell them whether the globe, on net, is hoarding or dishoarding.
One could point out that gold does not, on net, go into or out of anything. Yes, that is true. But it can come out of hoards and into carry trades. That is what we study. The gold basis tells us about this dynamic.
Conventional techniques for analyzing supply and demand are inapplicable to gold and silver, because the monetary metals have such high inventories. In normal commodities, inventories divided by annual production (stocks to flows) can be measured in months. The world just does not keep much inventory in wheat or oil.
With gold and silver, stocks to flows is measured in decades. Every ounce of those massive stockpiles is potential supply. Everyone on the planet is potential demand. At the right price, and under the right conditions. Looking at incremental changes in mine output or electronic manufacturing is not helpful to predict the future prices of the metals. For an introduction and guide to our concepts and theory, click here.
Next, this is a graph of the gold price measured in silver, otherwise known as the gold to silver ratio. It moved up again this week.
The Ratio of the Gold Price to the Silver Price
For each metal, we will look at a graph of the basis and cobasis overlaid with the price of the dollar in terms of the respective metal. It will make it easier to provide brief commentary. The dollar will be represented in green, the basis in blue and cobasis in red.
Here is the gold graph.
The Gold Basis and Cobasis and the Dollar Price
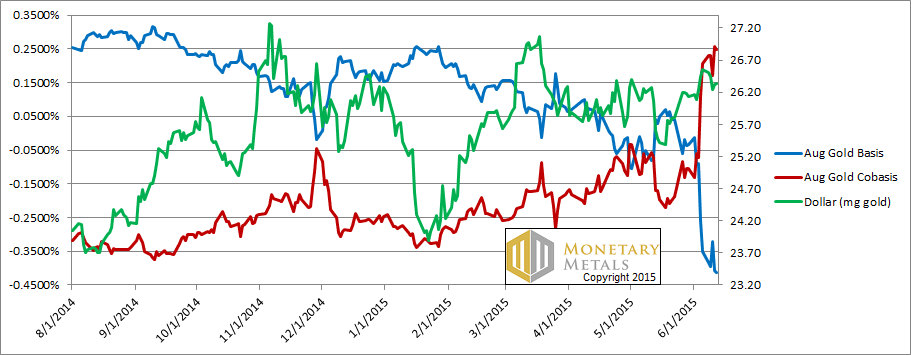
The dollar fell this week (i.e. the price of gold rose), and yet the scarcity of gold to the market (i.e. the cobasis) rose. Things get interesting when the red line diverges from the green line. That is, the scarcity of gold moved opposite to the value of the dollar (i.e. with the price of gold). In other words, we have rising gold price and growing (ever so slightly) gold scarcity.
Our fundamental price moved up dollar for dollar with the market price. In other words, buying this week was driven by physical metal.
Now let’s look at silver.
The Silver Basis and Cobasis and the Dollar Price
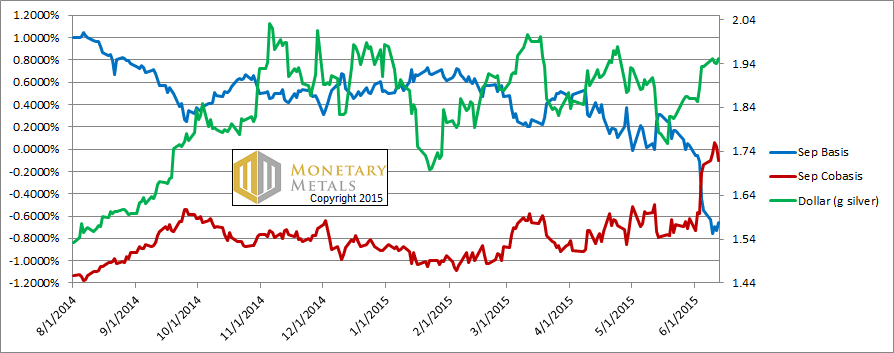
We have moved from the July to the September silver contract, as the former has become too volatile to be useful as an indicator.
While the dollar rose in silver terms, the scarcity of silver didn’t rise much. It’s interesting that we see the cobasis spike into backwardation (which is when cobasis > 0) but then fall back to nearly unchanged on the week.
There was some selling of futures in the first part of the week, and then metal on Thursday and Friday.
The fundamental price has dropped another 20 cents. The good news is that it’s currently within 60 cents of the market price. The bad news is that it’s still below.
© 2015 Monetary Metals
Thanks Keith
Are you aware of the proposed ABX exchange that Andrew Maguire is working on where you would be able to short XAU and Long AAU. AAU being 100% allocated gold. Playing this pairs trade would cause the POG to go down whilst causing sudden and deep backwardation. Do you agree?
The good news is that it’s currently within 60 cents of the market price. The bad news is that it’s still below.
Dear Keith,
Are Good and Bad dollar parlance terms? ;) I am paying attention to your data. thank you for doing it. and the commentary.