
A 14 Handle On Silver Again?! 1 Nov, 2015
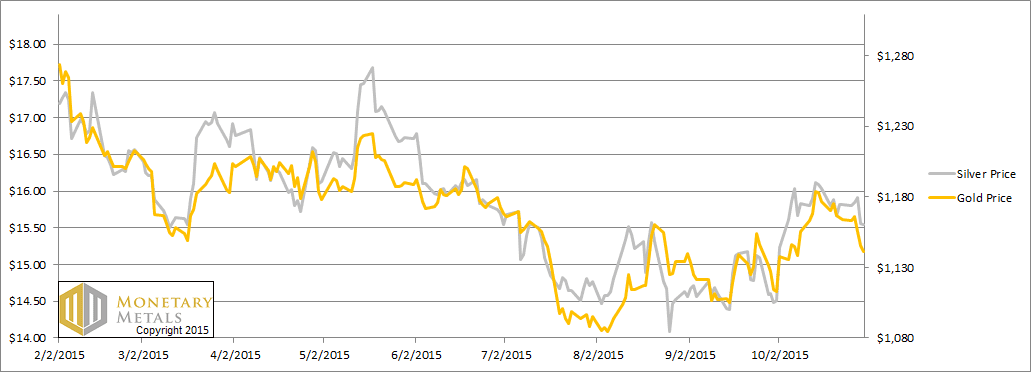
The prices of the metals dropped by 20 bucks and 20 pennies this week. In other words, the dollar went up ½ milligram gold or 30 mg silver. It wasn’t the euro, which ended the week unchanged. It wasn’t the US stock market, which ended up seven bucks.
What was it?
To answer this, we are reminded of a curious panel at the London Bullion Market Association conference a few weeks ago in Vienna. One of the panelists said “it’s hard to predict the price.” It seemed a lot like saying it’s hard to bend silverware by mind power. The panelists all agreed that the price of gold will fall, to like $800 or so. Readers know that we don’t see any such price in the data (and we don’t heed such predicts based on flawed methodology). Of course the fundamentals could change, but it’s no way to make predictions based on, “well things could change”.
In the same vein, we will not opine as to what caused the noise in the prices of the metals this week. It could be a large holder placed an order to sell. It could be that, in the words of Jon Snow, “winter is coomin’” (traveling in the southern hemisphere at the moment, we are reminded to say summer is coming here in New Zealand!)
What we do know is that the actions of buyers, and in this case sellers, leave their fingerprints on the market.
Read on for the picture of supply and demand fingerprints…
First, here is the graph of the metals’ prices.
The Prices of Gold and Silver
We are interested in the changing equilibrium created when some market participants are accumulating hoards and others are dishoarding. Of course, what makes it exciting is that speculators can (temporarily) exaggerate or fight against the trend. The speculators are often acting on rumors, technical analysis, or partial data about flows into or out of one corner of the market. That kind of information can’t tell them whether the globe, on net, is hoarding or dishoarding.
One could point out that gold does not, on net, go into or out of anything. Yes, that is true. But it can come out of hoards and into carry trades. That is what we study. The gold basis tells us about this dynamic.
Conventional techniques for analyzing supply and demand are inapplicable to gold and silver, because the monetary metals have such high inventories. In normal commodities, inventories divided by annual production (stocks to flows) can be measured in months. The world just does not keep much inventory in wheat or oil.
With gold and silver, stocks to flows is measured in decades. Every ounce of those massive stockpiles is potential supply. Everyone on the planet is potential demand. At the right price, and under the right conditions. Looking at incremental changes in mine output or electronic manufacturing is not helpful to predict the future prices of the metals. For an introduction and guide to our concepts and theory, click here.
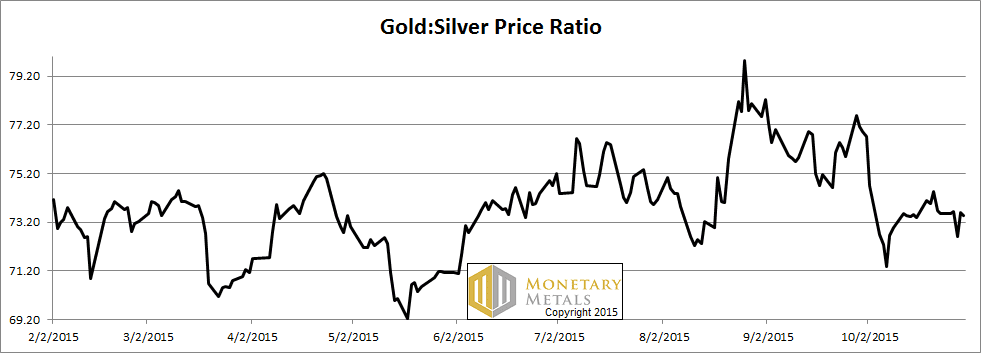
Next, this is a graph of the gold price measured in silver, otherwise known as the gold to silver ratio. The ratio barely budged this week.
The Ratio of the Gold Price to the Silver Price
For each metal, we will look at a graph of the basis and cobasis overlaid with the price of the dollar in terms of the respective metal. It will make it easier to provide brief commentary. The dollar will be represented in green, the basis in blue and cobasis in red.
Here is the gold graph.
The Gold Basis and Cobasis and the Dollar Price
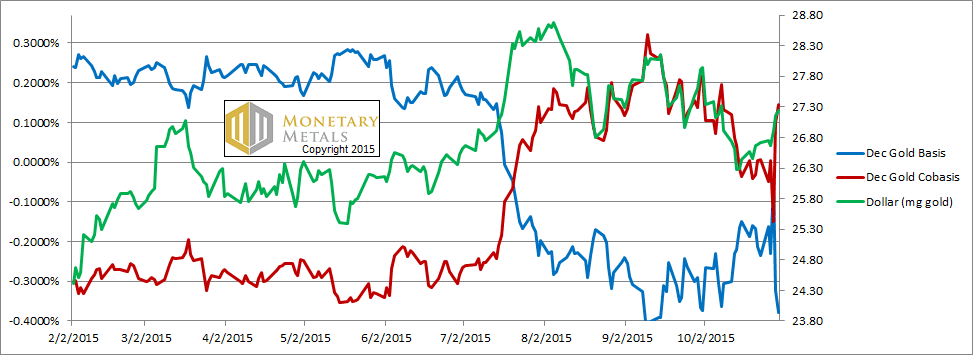
The scarcity of gold tracks still the price of the dollar in gold. You may be wondering what the heck happened on Wednesday 28 Oct. The scarcity (i.e. cobasis) dropped and the abundance (i.e. basis) spiked. The price of gold was $1180 for a while that day. It didn’t close at that price, it dropped but that was late in the day. So the abundance and scarcity are tracking the price more closely than the deviation that day would seem to indicate.
Our calculated fundamental price was flat on the week, about $1160.
Now let’s look at silver.
The Silver Basis and Cobasis and the Dollar Price
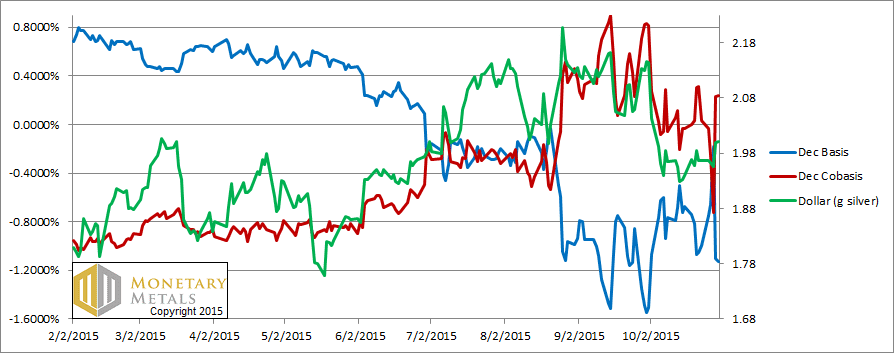
The same intraday price anomaly occurred in silver.
Unfortunately, for silver speculators (we reserve the word investment for buying an asset with the expectation of earning a yield, for financing something productive), the December data paints a more bullish picture than data from farther months. Both metals have a tendency for contracts to slip into backwardation as they near expiry. Silver does it in a bigger way than gold, perhaps because central banks can’t lease silver to smooth out volatility as they can with gold.
To put it in perspective, the Dec 2016 gold basis has been crushed down to +28 basis points (i.e. 0.28%). The silver basis for that same month is comparatively large +78 bps (both of which are highly affected by our zero interest rate environment).
Silver is simply more abundant than gold. Call it the industrial side of silver being weak, whatever you will. That is the fact.
We calculate a fundamental price for silver well over half a buck below the market price. This is where we got the headline for this Report. The fundamental price is well under $15.
Keith is helping put together a series of Monetary Innovation Conferences. The first two are in DC on Nov 13, and Phoenix on Nov 17. This is not just for the right wing, but for everyone from the unbanked to Wall Street. At the conference, speakers will discuss gold and how innovators are using it to solve real problems for real people. Please click here to register. After the conference, we may put on a Monetary Metals seminar if there is sufficient interest. Please click here if interested (different link).
© 2015 Monetary Metals
“Our calculated fundamental price was flat on the week, about $1160.”
I believe you mean $1260.
Keith,
Last week you had a fundamental gold price of approximately $1260 you say it’s flat on the week but now $1160, that’s a $100 fall?
Regards
Once again silver fails miserably at $16, consistent with the basis/co-basis signals that indicate a fundamental price far lower.
But gold also failed to sustain its recent rally, which is not at all consistent with its calculated fundamental price of $1,260.
It begs the question: Since the model’s inception, what is the maximum deviation in nominal prices from fundamental prices for both metals?
As a follow up: Can the spreads between cash and futures also serve as sentiment indicators?
Good catch Joken and rosslm888!
1160 is a type. It should say $1260.
Humm…. as I read more:
To say that a move “late in the day” didn’t matter as much (as a move earlier in the day) flies in the face of common knowledge… because we know that only the strongest holders of a stock/commodity/etc have the necessary capital, margin and conviction at the close of the day to hold a position. That’s why the closing price is universally considered the most important price of the day, and remains the best indicator of trend.
So what did happen on October 28th? A simple reversal, that’s all. Generally speaking, those higher prices above the opening on the 28th were soundly rejected…i.e., at which point sellers became quite aggressive and prices declined rapidly…. more in line with the market’s short term assessment of value.
Of course, that was only the kick-off move to lower prices. Here we are $60 lower in gold from those highs… and a $1.00 lower in silver, just days later.
It was a reversal to be respected, I would submit, regardless of what one thinks of fundamental values.
Having said that, while the fundamental gold price should be considerably higher (according to the model) it’s also possible that a rising GSR could save the day… and save the model, too, from considerable discomfort in the days/weeks to come.
What say you, Mr. Keith?
I didn’t say it is unimportant.
That said, I think all non-fundamental price moves are unimportant. Just speculators repositioning.
“all non-fundamental price moves are unimportant”. That’s funny. Or maybe I’m just too practical and callous.
Certainly in the theoretical world that can be true. But in the real world there are these pesky things called losses, limited capital, etc.
When a black box model, then, continues to say that gold is undervalued by $75 – $100 …. immediately prior to gold dropping another $50.00 one wonders what practical value such a model can possibly have. Really. Is the value in knowing that gold is now even more undervalued? That can be useful information, too, as long as it’s quantified. But at this point it’s not.
For a system like this to have any practical value (at least for me) the fundamental price would need to move prior to the actual fiat price, either way. Although there is one exception.
Alternatively, if an historical database could provide a range of values (with confidence intervals?) it could provide valuable Perspective. In other words, what are the odds of gold dropping more than $50, $100, $150, etc., below it’s fundamental value? Or rising those same amounts above fundamental value…. at least based on the existing database.
For example, maybe this current drop of $125 or $150 below fundamental is quite ordinary. You know, happens all the time. But maybe it’s not… this could be the best buying opportunity we’ll have in years.
How are we to know such things?
My devalued .02
Keith, thanks for the opportunities to comment. Let’s keep a little perspective here:
“gold does not, on net, go into or out of anything. Yes, that is true. But it can come out of hoards and into carry trades. That is what we study. ”
Would it be correct to state that the numbers of contracts and their dollar prices represent only a small physical slice of existing money? What 3%? 15-20%?. the rest is incognito and can be brought to market anytime. these analyses don’t cover everyman on the street. this is a controlled exchange with anonymous participants. for the everyman, it is the only public glimpse of information regarding the big hoard. it is where his dollar price gets set.
the pressures of the basis are real. I think this ties in with Fekete’s assertion of the dollar’s long term toughness before it blows. a small number of large holders could drag this thing out. why? the staggering amounts of gold available of course. that’s a guess. ultimately we just don’t know the status of the big hoard. the basis is the only clue. it is a small aperture to look through but it is not a price predictor. it does dovetail with the state of society though. just look at the bonds being issued to buy bullets.
“the market can stay irrational a lot longer than you can stay solvent” -some guy
Keith, the blue line over the red is contango right?
Keith, do me a favor and don’t print that silver is going to print a 12 handle until after I’ve opened my Christmas presents, ok?
If AG is sub-$13, AU could see triple digits… ya think? While I suppose anything’s possible…. a move substantially lower is NOT what I am expecting at all. My calculated range for 2015 is no lower than $1,030 gold… and there’s still reason to believe the lows are in already.
Why might the metals hold here? Well, for starters, bullish consensus in both metals is currently in the single digits. That’s low… really low. In the past that’s normally given us a bounce lasting at least a couple weeks. Conceptually it means that most of those interested in selling have already done so.
As a second bullish point, we are very close to previous lows… and many tacticians and strategists consider this an excellent time to buy (or sell) anything… on a re-test of previous support/resistance. In this case it’s support obviously…
In any event, commodities are bottoming right on schedule, at least in terms of their previous cyclical patterns, and 2016 promises to be a sector wide (commodities in general, gold in particular) turn higher.
The only fly in the ointment is that often the last days of an extended bullish/bearish move tends to be fast and furious. So an emotional drop from here of another $50 – $75 combined with lots of bearish commentary calling for dramatically lower prices (“$850” for example) would be a perfect buy setup.
….That was none other than John Maynard Keynes who said “the market can stay irrational.”
http://www.maynardkeynes.org/keynes-the-speculator.html
He was also credited with saying that “in the long run we are all dead”… suggesting that reckless fiscal policies should be tolerated. At one point there was talk that Keynes didn’t care about the future because he was gay and didn’t have children, an accusation levied by the very talented Niall Ferguson, whose work is quite good… and his blog here:
http://www.niallferguson.com/blog
Hey guys… don’t miss that great article in Minyanville called “Permanent Gold Backwardation: Why a crack up boom is inevitable”. (Dated May, 2011)
To me it’s important to differentiate between the last minutes of a fiat currency (often discussed here) with its value during the years or decades prior to its final demise. Like today, for example… when the dollar was bid very strongly and gold took another hit, backwardation or not.
Your cobasis calculation uses Spot (bid) minus Future (ask).
Spot gold is merely a global exchange rate XAU/USD.
Futures prices are specific to individual exchanges, with your calculation using CME Gold Futures. Why do you give preference to this exchange while ignoring gold futures prices in Dubai (DGCX), Singapore (ICE), LBMA Forward contracts and other exchanges?
Also, it has been claimed by London gold traders that physical orders of large size (10s of tonnes) command a substantial price premium to spot for immediate delivery. This would imply a much higher cobasis on large size. If true, is this irrelevant to the market forces you are attempting to quantify using smaller measures?
“spot gold is merely” – the rate you refer to and the one Keith is using is the wholesale London market rate as quoted on Reuters or Bloomberg, far from “merely”.
While it would be useful to look at other futures markets, and that would give some indication of that location’s physical/speculative balance, CME futures are by far the largest in terms of volume. The London forwards markets is also significant, but that is opaque, particularly since banks stopped quoting GOFO.
See https://preciousmetalsresearch.wordpress.com/2014/02/13/gold-markets-around-the-world-who-spills-over-what-to-whom-when-2014/ which studied London Spot, COMEX futures, TOCOM Futures and SHFE Futures and found that NY and London dominated gold price formation, with influence alternating between them.
As to the large orders premium, while this claim often comes from sources without much credibility, it is a fact in any market that if one is stupid enough to lay all of one’s cards on the table and demand their order to be filled now, that market players will take advantage of that desperation and move their quotes up. Indeed, the goldbugs make much of such large sell orders and their disproportionate impact on price, asking who would trade like that. So to answer your question, no I don’t think it is relevant to consider the basis/cobasis that would apply to unsophisticated large traders, assuming we could know what that “premium/discount” was, and rather just look at market prices as revealed by the actions of generally careful traders.
BTW, I have written on these large market trades and the price impact, to try and establish what the gold market’s actual liquidity is, see http://research.perthmint.com.au/2015/07/29/gold-market-liquidity-and-manipulation/