
A 14 Handle on Silver. Again. 8 Nov, 2015
What’s the difference between the Supply and Demand Report 1 November and the Supply and Demand Report 8 November? Just a minor punctuation change. Last week, we asked (rhetorically) if silver would have a 14 handle again.
This week, the market answered. Why yes, yes we can!
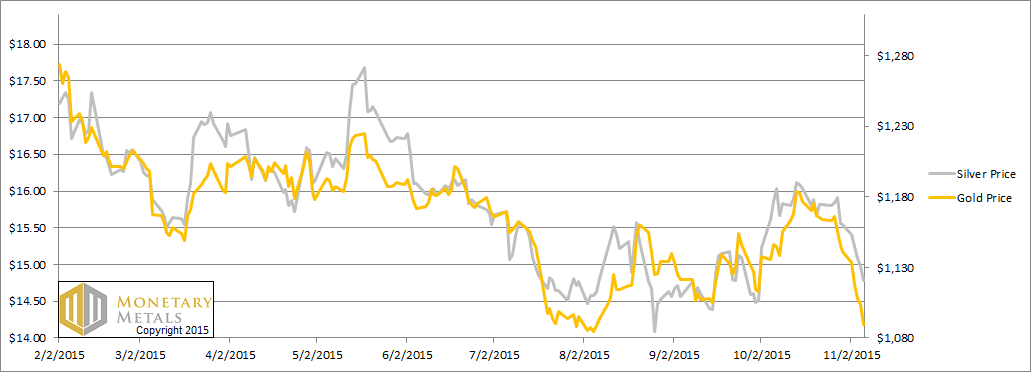
Silver closed the week, trading at $14.78. This is down $0.76 from last Friday and almost 20 cents under our fundamental price from that date. The price of gold also dropped, $52. This is quite a discount to what we calculate as its fundamental price.
So what happened? It’s always a challenge to explain a market price move in terms of a concurrent or preceding event, and financial reporters get it wrong all the time. In this case we feel pretty confident that the driver was the nonfarm payroll report, as the price of gold plunged about $15 within a minute of the release of the data on Friday.
Why? What has the payroll data got to do with the price of tea in China or the price of gold in New York? Traders (likely not hoarders, but speculators) are trying to figure out if the Fed will: (A) cut interest rates, (B) hold them steady, or (C) hike them. If they are to hike, then everyone wants to know when. Since the Fed has said it wants to see full employment as one measure of a recovery before risking a rate increase, the market looks to the Bureau of Labor Statistics for hints.
Such is life in a centrally planned world, where the most important price of all—the price of money—is administered.
There’s only one flaw in this approach. The price of gold does not correlate to the money supply or to the interest rate. In the 1970’s, we had a rapidly rising price of gold and skyrocketing interest rates. In January of 1970, one could have bought gold (if one was not an American—in America, it was illegal) gold for $36.56. By December 1979, the price was up to $593.84 which is a 16-fold increase. More than half of this gain occurred from 1977-1979, which saw the price rise from about $132 to $594.
During that same period 1977-1979, the interest rate on the 1-year Treasury went from under 5% to almost 12%, well over a double.
As to more recent years, let’s look at a graph of 2001 through present, overlaying the gold price with the interest rate.
The Price of Gold and Fed Funds Rate
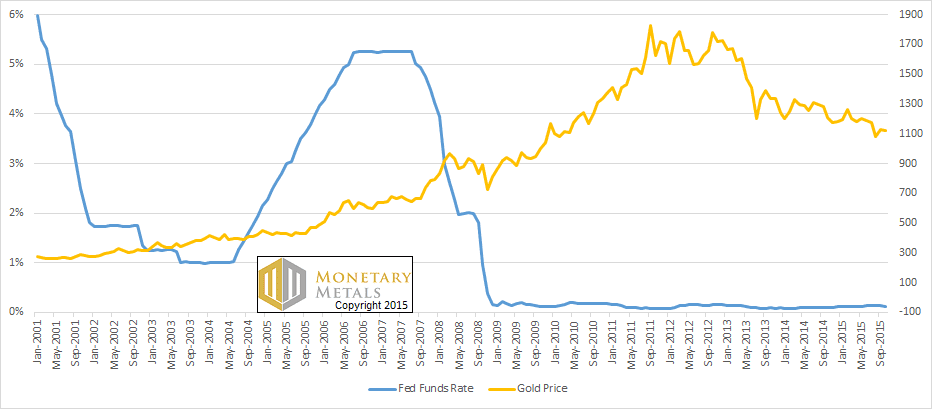
Here’s a trick question. If we told you the next interest rate trend, how would you bet on the price of gold?
You can’t.
We can tell you that our theory calls for a continuation of the 34-year trend: interest rates are falling worldwide. Although we can’t predict what the Fed will say at their next meeting, we don’t expect any major hikes, because the Fed cannot do it. We would have thought a 25bps increase was possible, but it seems even that meager rise would cause too much difficulty.
As to predicting the price of gold, we have a different methodology. Read on for our picture of supply and demand fundamentals…
First, here is the graph of the metals’ prices.
The Prices of Gold and Silver
We are interested in the changing equilibrium created when some market participants are accumulating hoards and others are dishoarding. Of course, what makes it exciting is that speculators can (temporarily) exaggerate or fight against the trend. The speculators are often acting on rumors, technical analysis, or partial data about flows into or out of one corner of the market. That kind of information can’t tell them whether the globe, on net, is hoarding or dishoarding.
One could point out that gold does not, on net, go into or out of anything. Yes, that is true. But it can come out of hoards and into carry trades. That is what we study. The gold basis tells us about this dynamic.
Conventional techniques for analyzing supply and demand are inapplicable to gold and silver, because the monetary metals have such high inventories. In normal commodities, inventories divided by annual production (stocks to flows) can be measured in months. The world just does not keep much inventory in wheat or oil.
With gold and silver, stocks to flows is measured in decades. Every ounce of those massive stockpiles is potential supply. Everyone on the planet is potential demand. At the right price, and under the right conditions. Looking at incremental changes in mine output or electronic manufacturing is not helpful to predict the future prices of the metals. For an introduction and guide to our concepts and theory, click here.
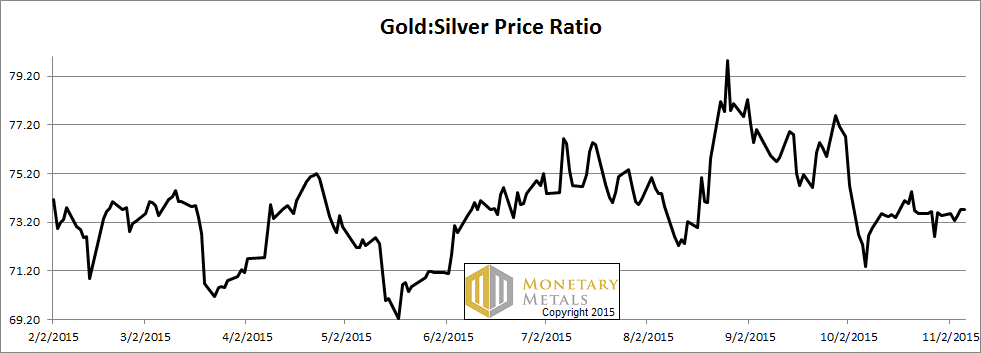
Next, this is a graph of the gold price measured in silver, otherwise known as the gold to silver ratio. The ratio barely moved this week, upwards.
The Ratio of the Gold Price to the Silver Price
For each metal, we will look at a graph of the basis and cobasis overlaid with the price of the dollar in terms of the respective metal. It will make it easier to provide brief commentary. The dollar will be represented in green, the basis in blue and cobasis in red.
Here is the gold graph.
The Gold Basis and Cobasis and the Dollar Price
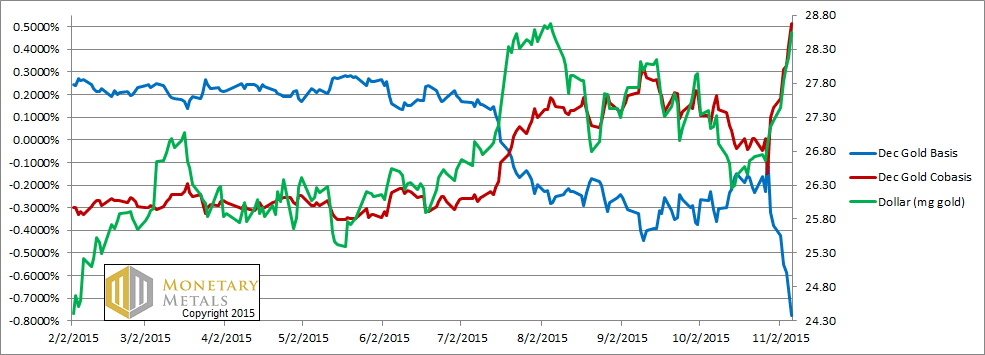
We’re still in the same mode. As the price of the dollar rises (i.e. people sell gold, i.e. the price of gold as measured in dollars falls) the scarcity of gold rises (i.e. the cobasis). The red and green lines continue together. Unlike the Fed Funds Rate and the price of gold, there is no an uncanny correlation between the cobasis and the dollar price.
This means that sometimes, speculators are selling futures (typically purchased with leverage) and sometimes they are buying. They have no effect on the price at which supply and demand would clear.
Which, as the price of gold dropped by $52, we calculate moved by only $2. Up. Does this mean gold will trade at almost $200 higher by tomorrow morning? Probably not. So what does it mean? It means gold is on sale, offered at a discount thanks to speculators that are going to lose a large number of dollars one of these days.
Now let’s look at silver.
The Silver Basis and Cobasis and the Dollar Price
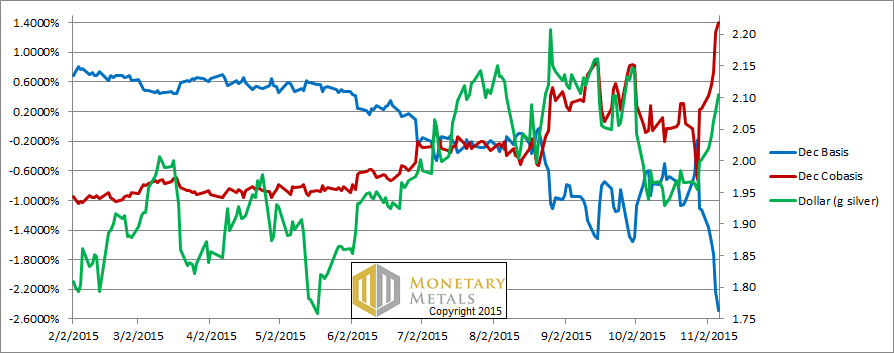
The silver price did fall relatively quickly, less than a month since we noted the market price was above the fundamental.
This week, the market price fell hard. The graph shows that the scarcity of silver rose even hard (though bear in mind that silver has much more of a cobasis distortion field than gold, as the near contract tends to tip into temporary backwardation before gold does, and deeper).
The fundamental silver price fell about a dime this week, thus putting the market price under the fundamental. While that’s a better place to be, if one is a silver bettor, we wouldn’t bet either way on silver right now. The action is going to depend on whether momentum continues to carry the price lower, or whether there’s a sharp rebound as speculators jump to the other side. Maybe those with razor-sharp technical models can make a buck here. That’s not for us.
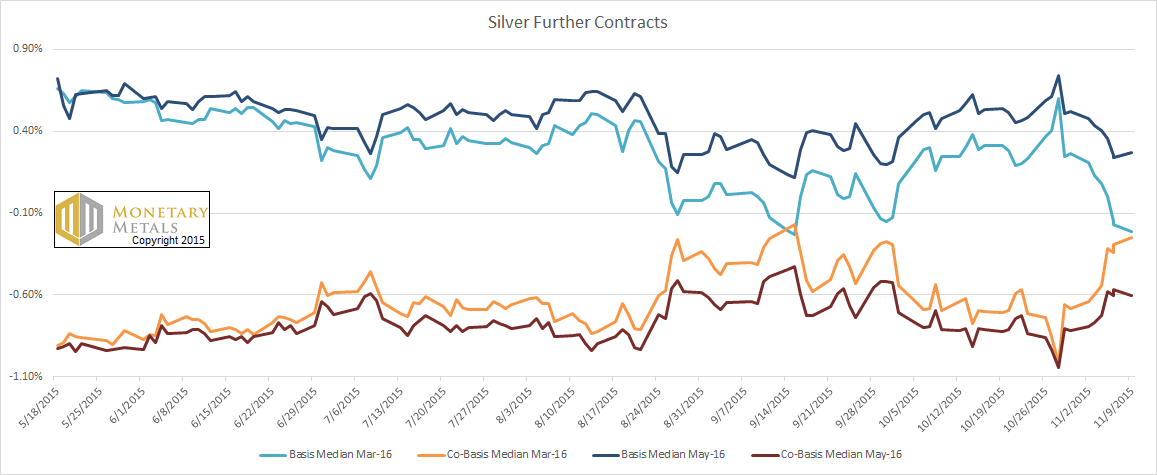
UPDATE 9 Nov
Based on questions in the comments thread, here is a graph showing the March and May silver bases. The basis distortion field in silver extends past December and is looks like it is already touching March. Whereas March looks close to breaking out of its range since late August, May is still in the range since July.
Do you support the gold standard? Please come and be counted. Show the legislature and governor in Arizona that honest money is popular! Please come to the Monetary
Innovation Conference in Phoenix on Nov 17 (Keith Weiner is a speaker). At the conference, speakers will discuss gold and how innovators are using it to solve real problems for real people. Please click here to register. After the conference, we may put on a Monetary Metals seminar if there is sufficient interest. Please click here if interested (different link).
© 2015 Monetary Metals
How about charting the gold price against the “real” (that is nominal less some inflation rate) 30 day interest rate. At one point, PIMCO claimed there was a correlation.
I don’t believe that one can use the rate of change of consumer prices to adjust interest. Interest is what it is.
It may be true that “Interest is what it is”, but there still may be a correlation between the price of gold and the interest rate less the CPI. It would be instructive if you published the graphs, to (at least partially) confirm or deny this correlation.
Thank you,
Paul
Here is the chart https://picasaweb.google.com/lh/photo/IprGq_dxxlZAjKmEhlcntdMTjNZETYmyPJy0liipFm0?feat=directlink
It is said that when real interest rates fall below 2% gold rises. That seems to be based on the two times it happened in the 1970s. Slightly less support for it in the 2000s bull market.
What can those of us that just can’t feel at all good about data accuracy when calculating real interest? If they did it right it would really show far more negative real rates. Which should have the monetary metals pricing FRNs lower, which boils us down to the choice between “manipulation”, or the sheople populace are so damn ignorant they can’t possibly fathom any merit in jumping off the debit Ponzi train, and instead prefer paying out the ass to be enslaved.
What we need are some specialized shrinks to help the .00001% of us that can do the math cope with the frustration of having to ride out this monetary spectacle amongst such mass ignorance!
Your explanation for the silver cobasis rising more than the dollar price in silver mg:
“(though bear in mind that silver has much more of a cobasis distortion field than gold, as the near contract tends to tip into temporary backwardation before gold does, and deeper).”
My observation:
SIZ15 has dropped by 5.5 cents from 2c contango at its high to 3.5c backwardation
SIH16 has dropped by 5.5 cents from 7c contango at its high to 1.5c backwardation
Where is the cobasis distortion? The near contract has not yet tipped into temporary backwardation; instead market tightness is causing cobasis to rise disproportionately in both SIZ15 and SIH16.
Is this deniable?
PS on the GSR
The GSR is tracking (upwards, as you often mention) but weakly and behind most of its support lines on the current 5 year uptrend. It has breached to the downside almost all of the many possible support lines for the GSR channel that could be drawn. If it drops to 71 (for example on a return of SIY00 to retest $16 with the normal 50% move in percentage terms in gold) then there are NO remaining support lines unbreached.
Just as price drops in both levels have led to EXCESS rises in the silver cobasis, they have also led to INSUFFICIENT rises in the GSR. These factors imply that the next price rises will cause GSR to breach more conclusively, which will feed further GSR bearish pressure from the physical market.
You emphasise that your system is fundamental rather than chart-led, but fundamental factors in the marketplace (i.e. portfolio reallocations from gold to silver by physical hoarders) are trend driven and these factors actually lead physical conditions since trend observations cause physical trades which then affect the things that you measure.
I submit that if GSR even revisits 71, and certainly 70, its uptrend is dead and physical market commentators like yourself should be making this abundantly clear, LONG before it tracks down to its longer term equilibrium points around 50 or even 60.
I agree with your general GSR comments. But any kind of mea-culpa is exceedingly unlikely from someone (anyone really) who views the world in this way. Gold was recommended at $1,700 all the way down to its current $1,100. Go back to the earlier backwardation articles — even 2011 — and see for yourself. This is a fundamental argument that has little to do with forecasting prices. At least forecasting them accurately.
That said, IMO long term holders are still likely make nominal dollars on the trade. You just have to ask yourself whether this approach to the market makes sense from a short term or trading perspective. I can only say that for me it does not.
Besides, does it make intuitive sense that some sort of ‘perfect’ fundamental price can be determined by an incremental deviation in basis? I would argue, as I have in the past, that (at best) the proof in the pudding…. and after another $100 drop in the price of gold (but none of it clears!! haha) this pudding is “fundamentally” uneatable.
That’s isn’t to say anything negative about Keith… not at all. He’s a great Austrian and a great guy overall. While I find his extrapolation of the basis/co-basis relationships questionable, his general version of monetary truth is much closer to realty than Paul Krugman’s.
While I always read in your reports that it is speculators who are buying or selling who are causing the sharp drops in price in both silver and gold, I see no mention of the odd times at which this occurs, and of the huge mounts which are traded. I also see no abrupt increases in price that come anywhere close to the declines. Do you believe in the manipulation that occurs on the futures market as recorded by GATA, or is that something that you discount, and if so, why? Thank you.
Thanks for your comments.
Ratio: I did something I don’t recall ever doing before. I updated the post with a new graph. It shows March and May 2016 silver.
As to the GSR, the ongoing theme of this Report is that speculators cannot sustain a price move. If they buy silver and sell gold when they see technical indicators, then you are right that the GSR will go down. And then where will it go? Eventually if that trend is exhausted, if everyone is in, then where next for GSR? If silver supply and demand don’t change, then the GSR has to bounce back.
Btw, the GSR need not be fueled by falling silver prices. It could be (and we expect it to be) fueled by rising gold prices.
Mike7.62: I have written a lot of material debunking the conspiracy theories. I encourage you to scroll back, there are 6 or 7 articles going back to early 2013. Also see the first video posted, my interview on Capital Account.
Like most reading this, I’ve bought a few coins in my day, sure. Almost always the coin dealer’s price is based on the Kitco “ask”… and I don’t disagree; it’s only a couple bucks more than the active futures month. So in that sense even I, too, am buying (my bid) over the futures ask.
Remind me, why is this such a big deal again? And one that suggests the entire financial system is about to blow?
It is not a big deal when retail products distributed in small quantity to consumers have a premium over 400-ounce bars in London. That is akin to buying food at retail, where an ear of corn sells at a much higher price than corn on the Chicago Board of Trade.
It’s a big deal when 400oz bars sell for a large and rising premium to contracts for future delivery.
Keith, please know your superb reports are highly regarded. I’m such a sucker for a nice sale!
hi Keith, find articles heavy and interesting. From my understanding of your articles I see the technical and fundamental pictures not playing out as they perhaps should, so this is a new angle of seeing crowd behaviour.