The prices of the metals hit their lows by the end of April. Gold traded for around $1,685, and is now over $1,900. Silver was around $24, and is now over $28. These are big moves (though of course nothing like bitcoin).
Both metals are subject to the persistent belief that their prices are greatly suppressed. But right now, silver is widely believed to be in a global shortage. We have explained this as a shortage of retail products, most especially one-ounce silver Eagles which currently trade for a premium of 36% or more over the spot price. We have explained the difference between retail products, which depend on finite manufacturing capacity vs. commercial 1000oz bars.
But today, let’s look at the data. First, here is the silver basis.
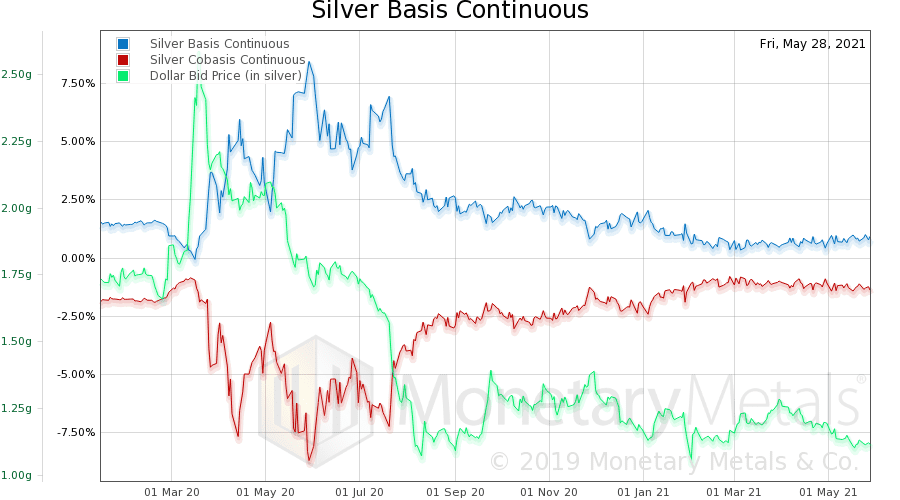
We have zoomed out to show 500 days, and to do this we use the continuous basis (i.e. not a particular contract month, but a mathematically constructed 6-month continuous contract). This lets us see a long period of time, without worrying about where different contracts splice together. And it removes the tendency of each month’s basis to fall as its respective contract approaches expiration (the key to our proof that the banks are not selling futures naked short).
The blue line is the basis, the measure of abundance of the metal to the market. The red line is the cobasis, the measure of scarcity. The green line is the price of the dollar, as measured in silver (call us crazy, we believe that a metal which has been money for thousands of years is better suited to measure the irredeemable debt paper of the government, than said debt paper is for measuring money).
Notice first the spike up at the onset of the covid crisis, from about 1.8 grams of silver, to a brief high of 2.6g. Then, it goes into a falling trend that has not let up yet. Currently, the dollar is down to 1.12g.
When the price of the dollar was spiking (which most people would call a crash in the price of silver), there was no corresponding big move in silver’s scarcity (there was a move, but it’s small). After covid hit, there was a huge change in the apparent scarcity, and the volatility of the apparent scarcity. We have written that this was an anomaly due to covid restrictions and did not indicate massive abundance of silver.
Here is a graph of the spread between the basis and cobasis (basis – cobasis).
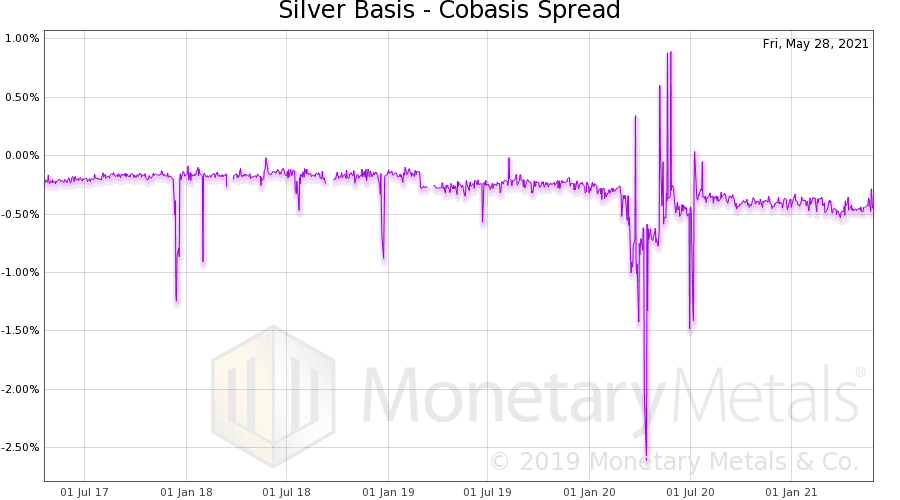
There is a huge blowout around the beginning of March, 2020. But it not only looks like it is back to normal, but it is tighter than pre-covid.
Anyways in 2021, the basis and cobasis have reverted to what looks like a normal spread. And, importantly, these indicators show less abundance and greater scarcity, respectively, than pre-covid. We note the importance, because the price of the dollar is considerably lower (i.e. the price of silver is considerably higher) than it was.
A higher scarcity corresponding with a higher price—this is the very picture of a fundamental price move. It is not merely an increase in speculative positions in the futures market, using leverage. It is an increase in the buying of physical metal (if not to the degree promoted in online discussion groups).
There is a slow but noticeable drop in scarcity since around the end of February. This should be watched to see if it continues. Silver bulls would not want to see a trend of falling scarcity, especially if the price were to hit a ceiling that it is reluctant to move above.
Here is a graph of the silver term structure. This shows the basis and cobasis for each futures contract, starting with the July contract and going out to September 2022.
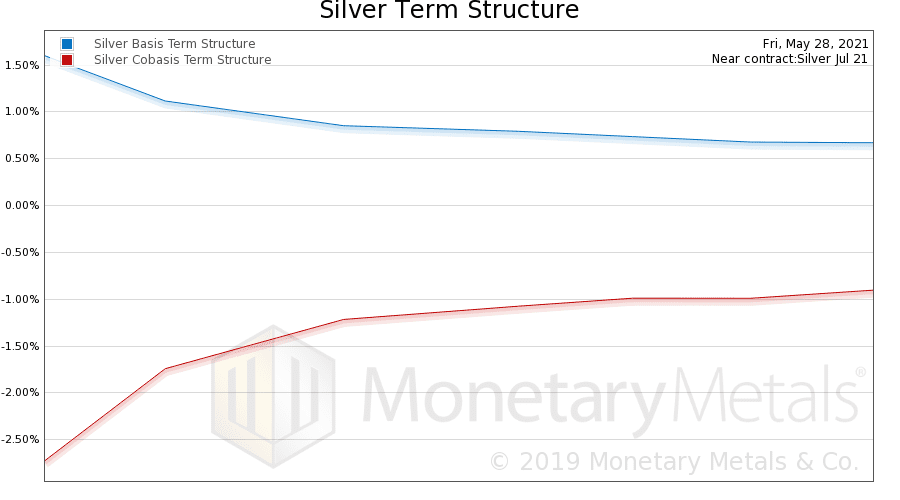
Both lines are inverted.
That is, there is greater reluctance to buy more distant contracts, compared to nearer contracts. This is akin to an inverted yield curve, where the yield to carry silver for a month is 1.5% annualized but the yield to carry it for 16 months is 0.67%. By comparison, the term structure in gold is basically flat.
Just to head it off at the pass, if one believed that the banks were naked selling futures to manipulate the price, that would push down the near-contract basis. That it is high, can only mean only one thing. There is a lot of buying of July silver contracts. And to a less degree, of September.
Let’s look at one last graph. This is a multi-year chart of the silver lease rate. We calculate the lease rate as the point of “zero arbitrage”. It does not include the market maker’s overhead including compliance costs, desired profit, or credit risk premium.
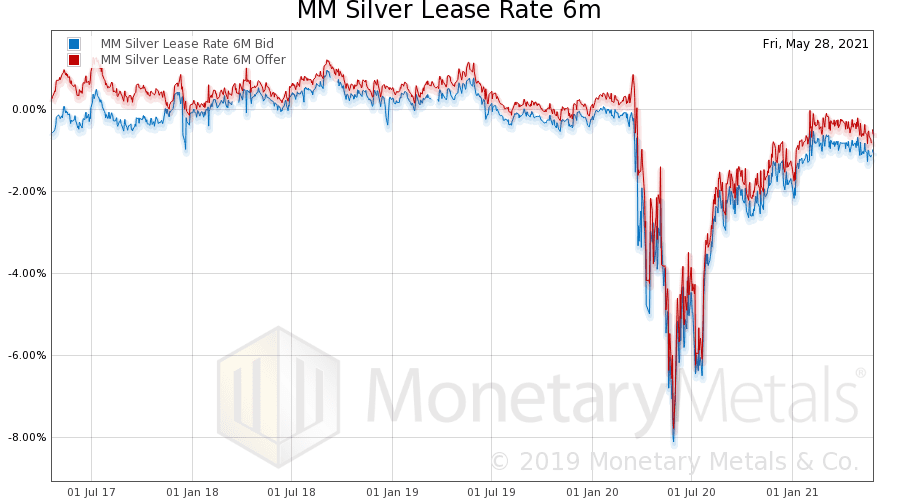
Lower lease rates mean that the metal is more abundant to the market. It was near zero for years, indicating that the basis was high relative to the interest rate. The lease rate is equal to LIBOR – the forward rate. And the forward rate is closely related to the basis.
The lease rate apparently plummets to well below zero in the wake of covid. We say “apparently” because no one will lease out silver below zero. Given the incredibly high basis, the “zero arbitrage” point dropped this low. This was an artifact of covid and not a real spike in the abundance of silver, as we said at the time. And note that the silver lease rate is still negative (the gold lease rate is also below zero, though not as far).
From this graph, we conclude that one of the following must be true:
- Silver is still quite abundant
- The central planners ought to raise interest rates by more than one percentage point
- The market makers are not back to normal, even now in the “post covid” environment
- Market makers are beginning to comply with Basel III
We do not believe that silver is so abundant as this would suggest. So scratch this off.
We are just kidding about 2. Of course, every act by the central planners may have the outcome they desire (or may not), but will certainly have many perverse outcomes that central planners make it their business not to know. If LIBOR were higher, then it would become more expensive for market makers to borrow to buy physical metal and sell futures—to carry silver. With less carrying, which is a response to when speculators bid up futures, the basis would be higher. Thus the silver forward rate would be higher, to go along with a higher LIBOR. And the lease rate might still be underwater.
In Keith’s dissertation, he proved that all acts of government interference in markets reduce the capability of productive people to coordinate their activities in the economy. A negative lease rate, or apparent lease rate, is but one tiny example of this principle.
Once covid lockdowns hit, it became more difficult and slower to ship bars of metal around. This discouraged arbitrages such as carry, as delivery may require shipping the bar. We assume that most of these logistical difficulties are mostly eased now, but this segues into choice D. Basel III dictates a “Net Stable Funding Ratio” which increases a bank’s effective cost of capital to carry gold or silver. This has a similar effect as a higher LIBOR. If we plotted a NFSR-adjusted lease rate, we would expect it to be a positive number.
NSFR-Adjusted forward rate = (LIBOR + increased NSFR costs) – forward rate
Is the increase in cost greater than one percentage point? We would expect so. And if so, then one may safely assume that the lease rate is a point or more higher, to correspond to the higher cost of capital for banks to fund carry of gold and silver.

Thanks, Keith, I’ve been wondering about the Basel III thing.
Yes you’ve hit the nail on the head. The key section that people seem to miss is “to the extent the gold bullion assets are offset by gold bullion liabilities“.
Correct me please if I am wrong : Basel III compels banks holding gold to neutralize the worth and the eventual leverage through gold holdings by imposing an equal a liability on his superb asset ?
In others words Basel III penalizes banks for holding gold ?
Is it unfair or is biased to scare banks from holding solid gold ?
So the best place for holding gold should be in a parallel system , where me, you and many friends can enjoy receiving extension of cash credit based upon the evolution of the spot price of Gold ?
The kind of credit card Peter Schiff with his euro-pacific bank located in Australia tries to promote , but it seems it does get very popular .
I look forward to read your observations
“According to the FDIC, as of this writing, the national average for checking accounts is 0.06%. According to the St. Louis Fed, a 30-year mortgage is 4.28%. A bank could make 4.22% by funding 30-year mortgages with checking deposits (before expenses). Not a bad business.”
But, Keith, isn’t it actually much better business than that due to fractional reserve banking?
With a reserve ratio of ten to one, the Bank could lend out what it borrows ten times over, so it could effectively be getting 42.8% against the 0.06% it pays out making an arbitrage profit of 42.72%.
Matrerial I read some time ago maintained that, in modern banking on both sides of the Atlantic, there is effectively no limit on the ratio that banks may operate. I mentally went on to append, “. . . other than the solvency and funding requirements laid down in the Basel accords”.
Notwithstanding, as you go on to explain, that this (demand deposit v mortgages) is not the way banks actually fund their lending, I would be very interested in your take on the effect or otherwise of fractional reserve on your arguments here.
The Net Stable Funding ratio is precisely a “reserve fraction” (for the asset class) considered acceptable under Basel conventions. So, saying gold has a 85% requirement is like saying: to lend out $100 of gold, a bank would need to have $85 of deposits in its reserves. That is far more than private 19th century banks kept (between 25% and 50%) in fractional reserve, and thus makes gold-based banking unprofitably stable.
It is interesting that fully hedged gold and a T-bill have the same regulatory risk profile. Stability within the bank’s numeraire (presumably the global reserve currency US dollar) seems to be the only objective. Why is such an agreement being reached in Basel Switzerland, ex domain of said legal tender?
Good question Gregory and thanks for the explanation of Net Stable Funding ratio.
Since reading your reply I have read through Keith’s whole series of articles on The Unadulterated Gold Standard. It certainly turns a lot of my previous understanding on its head, and begins to address my original question in part 3, where, in writing about fractional reserve, he trashes the idea ‘that banks “create money” ‘.
Whereas this does seem to contradict a lot of what I’ve previously read – including certain publications by the Bank of England, the Federal Reserve and a monetary reform group in the UK called Positive Money, I’ve learned over the years of reading Keith’s material that his approach to all things monetary possesses a simple underlying logic that often explains what is happening in the real world so much better than the guile of politicians, the projections of many economists and the hype of gold and silver ‘bugs’, whose announcements that gold and silver are about to skyrocket have been growing ever more shrill since I began to be interested and yet without any real fulfilment. It makes one wonder why anyone still listens to them. I certainly stopped paying them any serious attention some years ago after I discovered Keith’s more intelligent analysis whose correspondence with reality seems far better.
It will probably take me several re-readings and some careful thinking to glue my comprehension of money mechanics back into a complete entity including this disruptive new material.
What are the Net Stable Funding ratios under Basel 3 for other types of banking ‘assests’?
Hi, I’m trying to better understand the regulation.
On the liability side: https://www.bis.org/bcbs/publ/d424.pdf
Here it says a 0% risk weight will apply to gold but further on, a haircut of 20% is specified in all models.
Moreover, we have the minimum capital requirements: https://www.bis.org/bcbs/publ/d457.pdf
We can read that gold is a commodity with a risk weight of 20%: “7 Precious metals (including gold) Gold; silver; platinum; palladium 20%”
But further on, it says:
40.53 This section sets out the simplified standardised approach for measuring the risk of holding or
taking positions in foreign currencies, including gold.[19]
Footnote
[19] Gold is to be dealt with as an FX position rather than a commodity because its volatility is
more in line with foreign currencies and banks manage it in a similar manner to foreign
currencies.
For both forwards and options, gold is considered foreign exchange, not commodity:
(b) For options on equities and equity indices: the market value of the underlying
should be multiplied by 8%.[38]
(c) For FX and gold options: the market value of the underlying should be
multiplied by 8%.
(d) For options on commodities: the market value of the underlying should be
multiplied by 15%.
Is it correct to say that the 0% (or 20%?, multiplied by 8% if gold forwards/options) risk weight applies when a bank uses gold as collateral when borrowing (including demand deposits) ?
O the asset side: https://www.bis.org/bcbs/publ/d295.pdf
Gold has an RSF (required amount of stable funding) factor or 85%.
Does that means that one needs 100 ounces of gold as collateral to take a loan of 15 ounces of gold equivalent in dollars from a bank ?
What’s missing here is price. You only have to see that the BIS assigns a risk factor of only 50% on mortgage-backed securities and 85% on gold itself to realize that it feels that the risk of large defaults of home loans to an overleveraged public is LESS than the risk of the price of gold going down in price (pp 9-10). Thing is, if the price of real estate drops far enough (layoffs, herd mentality) people are going to jingle-mail their house keys even if they can afford to make the monthly payments because no one wants to pay off a loan that is worth substantially more than the value of the house! So once again they have characterized the wrong thing as risky under an avalanche of a PhD level word salad.
https://www.bis.org/bcbs/publ/d295.pdf