
Gold Costs 80oz of Silver, Report 21 Feb, 2016
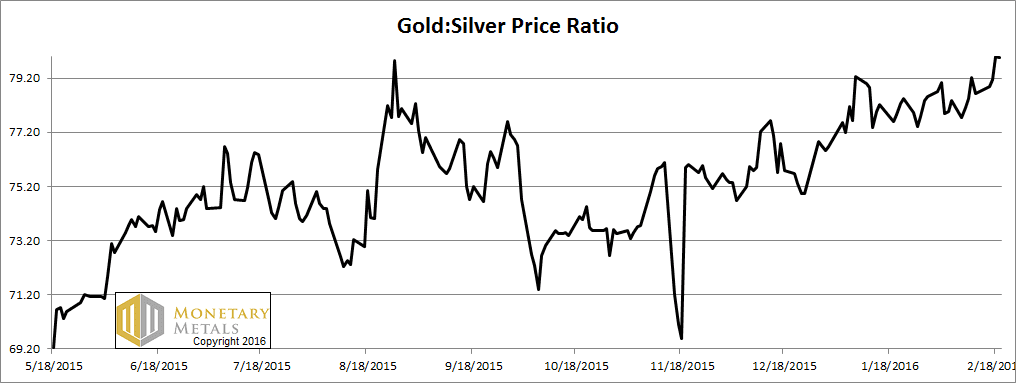
The big news is that the gold-silver ratio closed at 80. This is not only a new high for the move. It’s higher than it has been since 2008.
It’s also exactly what Monetary Metals has been calling for. Last week, we said the gold fundamental was $1,450 and the silver fundamental was $14.90 (i.e. a fundamental value for the ratio over 97 last week). This week, the ratio moved up, and it’s now 1.3 points closer. In other words, silver got cheaper when measured in gold terms.
We had a soggy dollars spotting this week (our term for an article that’s misleading or based on false assumptions). A gold mining executive declared that the people are losing faith in the central banks. The take-away was clear: the gold trade is on again! buy gold now, to make big profit$.
It should be bloody obvious that he just wants you to bid up the price of the product his company sells (i.e. gold). He wants to make money (i.e. dollars).
But that aside, our larger point is that articles like this (and there are plenty of them) are quite ironic. When there is a loss of faith, there will be a great paradigm shift. No longer will people think of gold going up, but of the dollar going down (and finally, collapsing). That is not occurring today. These articles exist just to rationalize a trade. The dollar still enjoys the full faith of everyone—most especially the gold bugs who need a currency in which to measure the worth of their gold, and in which to take their profit$ when they sell.
Read on for the only true picture of the gold and silver supply and demand fundamentals…
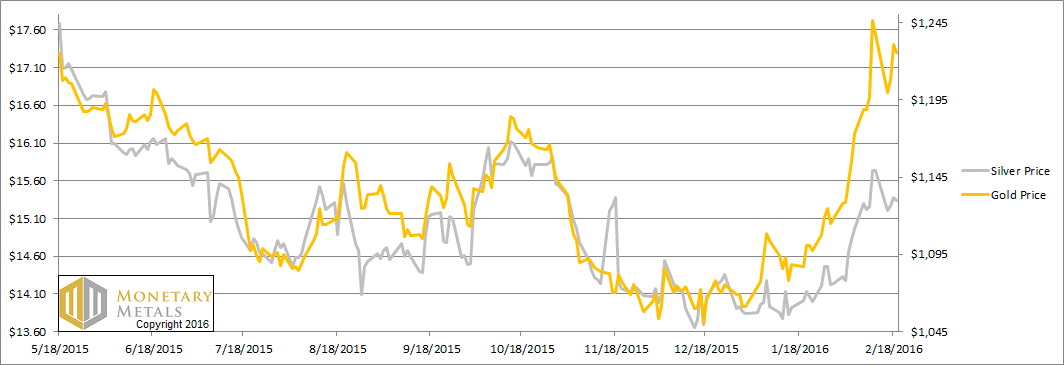
But first, here’s the graph of the metals’ prices.
The Prices of Gold and Silver
We are interested in the changing equilibrium created when some market participants are accumulating hoards and others are dishoarding. Of course, what makes it exciting is that speculators can (temporarily) exaggerate or fight against the trend. The speculators are often acting on rumors, technical analysis, or partial data about flows into or out of one corner of the market. That kind of information can’t tell them whether the globe, on net, is hoarding or dishoarding.
One could point out that gold does not, on net, go into or out of anything. Yes, that is true. But it can come out of hoards and into carry trades. That is what we study. The gold basis tells us about this dynamic.
Conventional techniques for analyzing supply and demand are inapplicable to gold and silver, because the monetary metals have such high inventories. In normal commodities, inventories divided by annual production (stocks to flows) can be measured in months. The world just does not keep much inventory in wheat or oil.
With gold and silver, stocks to flows is measured in decades. Every ounce of those massive stockpiles is potential supply. Everyone on the planet is potential demand. At the right price, and under the right conditions. Looking at incremental changes in mine output or electronic manufacturing is not helpful to predict the future prices of the metals. For an introduction and guide to our concepts and theory, click here.
Next, this is a graph of the gold price measured in silver, otherwise known as the gold to silver ratio. The ratio was up to a new record weekly close.
The Ratio of the Gold Price to the Silver Price
For each metal, we will look at a graph of the basis and cobasis overlaid with the price of the dollar in terms of the respective metal. It will make it easier to provide brief commentary. The dollar will be represented in green, the basis in blue and cobasis in red.
Here is the gold graph.
The Gold Basis and Cobasis and the Dollar Price
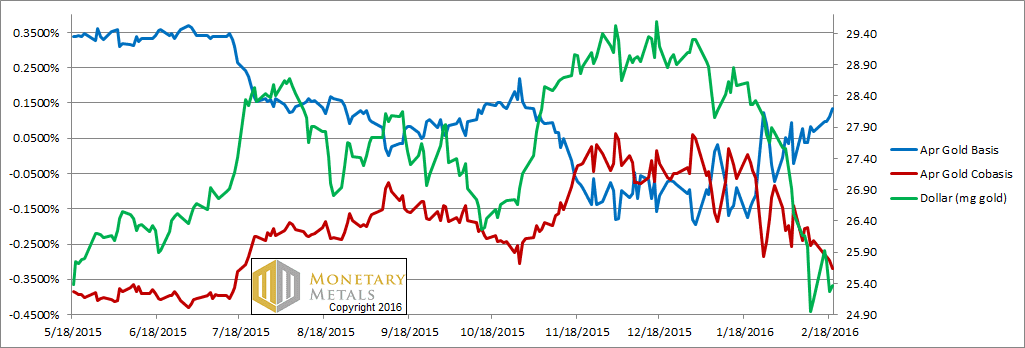
The dollar went up a quarter of a milligram (i.e. the price of gold fell nine bucks). And the scarcity of gold (i.e. the cobasis, shown in red) fell a little.
That said, there’s still quite a bit of scarcity in the gold market. Although our fundamental price of gold is down 13 bucks, it’s still over $1,435. And that’s over $200 over the current market price.
Our prediction of a rising gold-to-silver ratio is not based on the common pattern of both metals going down—in dollar terms—with silver going down more.
As we noted in a prior report, it becomes easier to see in gold terms. The dollar and silver are both going down now—in gold terms.
Now let’s look at silver.
The Silver Basis and Cobasis and the Dollar Price
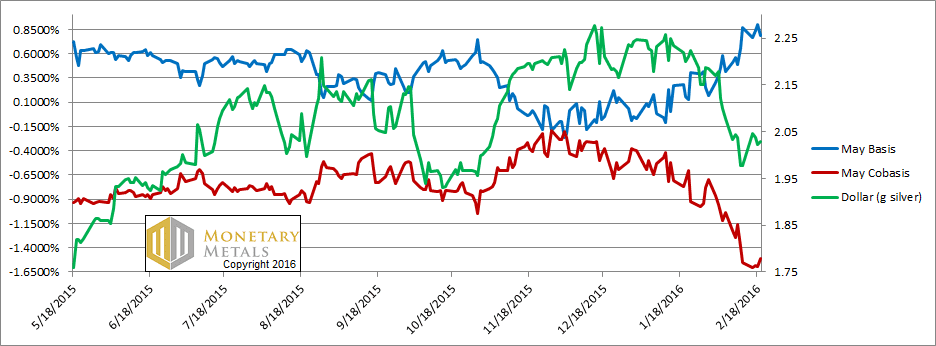
We finally switched from looking at the March silver contract to the May. First Notice Day for March is a week from Monday and the bases are becoming very volatile. That said, and unlike in the past, the silver basis for March is still positive. We coined the term temporary backwardation, because contracts for gold and silver—and silver much more than gold—tended to tip into backwardation as they approached expiry. Not in silver now, at this price.
Unlike the trivial price move in gold, the one in silver was more substantial—40 cents. The silver cobasis (our scarcity indicator) barely budged. It’s still in the basement, rising from -1.55% to -1.51%. For reference, the gold cobasis is -0.32%.
We have been observing a pattern for several weeks. We wrote about this phenomenon a while back. I am talking about “icicles” on the price chart. They occur in the spot price, but not futures. Here is a picture of most of the trading day (times are Arizona time).
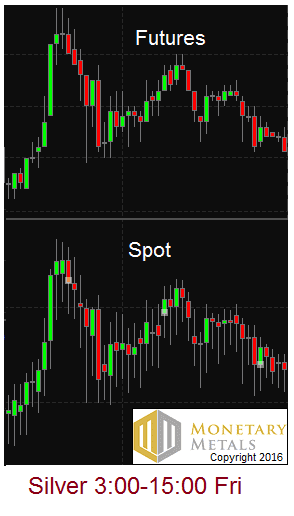
Notice the visual difference between the two. Spot has these dripping lines, where the price temporarily fell but then recovered before the close of the time period. These happen to be 15-minute candles, but the same thing occurs with other periods. If you watch it in real time, you see the price drop, then drop, then drop, then snap back. Repeatedly. This has been going on for weeks.
On the futures chart, the drooping lines are much less frequent, and appear more balanced with lines above (like what one would expect with normal market price fluctuations during any 15-minute block on any actively traded security).
What does it mean?
We think it shows in the price chart what we see in the basis. The silver basis is showing weak demand. For the May contract, the basis is 78 bps. This is the yield (quoted as an annualized percentage) that you can earn by carrying silver—buying metal and selling a future against it. It’s a spread, with no price risk, for a 3-month position. For reference, 3-month LIBOR is about 60 bps. The silver carry trade is attractive right now. Certainly, it’s much more attractive than carrying April gold, which yields 13 bps (annualized).
We think that what’s happening is that the price of silver metal is selling down, and every time the carry rises to a threshold, arbitrageurs are buying spot to sell futures and pocket that spread. If they wait for opportune moments, we’re sure they can make over 1%.
The marginal demand for silver is to go into carry trades, into the warehouse (we do not mean necessarily to be stored in a COMEX approved depository and this has nothing to do with those persistent rumors that the COMEX depositories are running out of metal, that they’ve sold the metal 100 times over, etc.) We are looking at marginal supply and marginal demand here.
The risk is that today’s marginal demand—namely the warehouse—can turn off abruptly. And it can become tomorrow’s supply.
Silver in the futures market—silver paper, you will—has more robust demand than silver metal in the spot market.
Metal, of course, is often bought unleveraged by hoarders. Paper is often bought by speculators, who could be using 10:1 leverage. We realize that this is not the Narrative that circulates in the silver bug community. Yet these icicles on the price chart offers another look, using a different data set than what Monetary Metals normally focuses on.
The fundamental price of silver fell a few pennies more than the market price this week. It’s about 80 cents below market.
The fundamental price of the ratio rose even more.
© 2016 Monetary Metals
So, short term, according to your metrics, gold should outperform silver even more than it already has bringing us to an even higher GSR. What is your longer term view of the GRS? Say, for example, after a financial collapse or whatever it is that we are headed for.
Gold and Silverstocks are currently on a 70-year low. If gold rises to $ 5000 till $10.000 some gold stocks will have a thousandfold. http://gebert-trade.weebly.com/1000-bagger-potential.html
Another terrific article Keith and thank you.
My take is this.
Why swap dollars for gold only to swap it back to make a profit of more dollars?
I suppose some traders may be able to do that but it seems like a lot of hassle and work, as well as good luck.
Gold is easier to store etc…just buy the stuff. It will come into its own, one day !
Gold is a no risk asset.
“They occur in the spot price, but not futures.” who knew?
“For the May contract, the basis is 78 bps. This is the yield … that you can earn by carrying silver—buying metal and selling a future against it…..For reference, 3-month LIBOR is about 60 bps. ”
Instead of “fundamental” I think it should be called “we dare you not to deliver at the implied dollar conversion rate”. The basis is a preponderance of bets. The minute they fail to deliver fiat goes supernova.
It seems to me that massive amounts of gold and silver are being flipped around but only fractionally moved around in order to shore up fiat balance sheets. For the man on the street it has little to do with the value of coins except possibly how to get the most for your fiat. We’re all gamblers now.
the only reasons to play are to be on the ground floor of the big reset or figure out how to use them to trade amongst ourselves immediately.
Thanks for the comments.
1000: I remain amazed that after reading the above, you would say “gold rises” without any apparent sense of irony. :) If the price of gold rises so much, i.e. the dollar falls so much, you will not like what is happening to every other part of the economy. There could be violent unrest.
jham: I always say to people who use the term “reset” that they should picture 476AD. The population of Rome was over 1M people. After their reset, it dropped to less than 10,000. Reset is a euphemism for disaster in which many people lose their lives.
Do not be afraid, it is just capitalism which is dying ! It will disappear like paramount communism (sorry for this c word here), slavery and feudalism.
How many decades, this agony will take, nobody knows.
The most interesting part is when all the worldwide powers including anglo american and european ones, and BRICS ones will unite to try to save it, but despite all their will, moves, wish and even prayers, they will ultimately fail !
In the meantime, it will rock indeed…
Racoon: I think silver has a role to play as money. In a free market, I’d expect silver to trade at less than 30 to the gold ounce, and maybe closer to 20. I don’t expect it to attain 16. Electronic gold accounts allow grams or even fractions, and the Aurum is a physical gold product with 1/10 gram gold, so I think some demand that would have gone to silver can go to gold.
Thanks for your reply, as always.
So if the GSR ratio will ultimately wind up back down in the more realistic 20 or 30:1 range then it seems that those who intend to hold PM’s long term would be better served to be purchasing silver at this point in time. Then when the GSR comes back down into the twenties they could trade some of their silver in exchange for gold.
If someone purchased silver now (with fiat dollars) and used this strategy to trade HALF their silver for gold when the GSR got down to 25:1 then they would wind up with a lot more gold than if they just purchased gold today. AND the remaining half of their silver hoard would essentially have cost them nothing. Only flaw with that strategy is that it might take a long time for the GSR to make it back down into the 20’s and in the interum it could continue to climb as it has been doing (as you have been predicting).
Hi Keith,
I am trying to follow along, and, make a determination based upon your article, which of the two precious metals (gold or silver) it makes sense to purchase now in physical form, and hold for the long term. I don’t know if this answer can be extracted from this article, but, that is the foundation of my question. Thx, LOTRADER
Keith,
Apologies if this question is off topic but I am wondering if you have the ability to plot the gold basis and co-basis in other currencies. Is that even possible given that gold is priced in USD? I am not speaking about converting the USD gold price to something else such as the JPY gold price. I am specifically curious to know if in countries that are now experiencing a negative rate of short-term interest the basis has collapsed and the co-basis has soared. Shouldn’t those countries have reached a permanent state of backwardation?
Thank you.
Futures market derived basis are similar to forward rates, so for other currencies you can work that out by looking at the differential of interest rates between gold and the currency. I sort of covered that in this post http://goldchat.blogspot.com.au/2008/12/gold-isnt-in-backwardation-usd-is-in.html
It will be a future extension to look at TOCOM, SGE, SGX and (on its way) ASX gold futures markets for a read on local market conditions.
“Reset is a euphemism for disaster in which many people lose their lives.”
I thought that is what is at stake here. You once said “this has nothing to do with fiat macro. It has to do with the twin dollar pathologies of rising debt and falling interest. These flaws are fatal.”
that’s a deduction not a prediction. timing is the only unknown. that’s why I pay as much attention here as I do espn. appreciate your work!
“icicles”, that’s cute. It’s called a shadow, either upper or lower.
http://stockcharts.com/school/doku.php?id=chart_school:chart_analysis:introduction_to_candlesticks
In cash markets shadows are more common due to the relative lack of liquidity compared to futures.
Kieth, I struggle to understand your stated 40-cent price move in silver last week. According to the end-of-day spot prices at StockCharts.com ($silver), the move was 58 cents. That is close to the 56 cents at http://futures.tradingcharts.com (continuous weekly contract). The Handy & Harman move reported in Barron’s is 68 cents. Where can one find your much smaller 40 cents?
Frankly, don’t know why you bother with Zero Hedge. It’s a very savvy and educated crowd when it comes market mechanics… and it’s apparent MM theories are not well received there.
I, on the other hand, believe the approach deserves a full, fair and complete hearing…. which is nearly impossible the way the data and results are currently presented.
Anyway, you’d probably have better marketing luck with the more permabull audience at kitco or gold-eagle. As long you you say gold is going higher in dollar terms (or in terms of their local currencies) the bulls will love you.
Racoon: The GSR is likely to head higher, perhaps a lot higher, before it heads lower.
Lotrader: How long is long term? Right now, I expect silver to get cheaper in gold terms. That may or may not bother you as a holder of silver, depending on your time frame.
Jim: It may be an interesting exercise to plot the basis in other currencies, but it would not necessarily show a withdrawal of confidence. I think it would mostly reflect the (wider) bid-ask spread of the other currency.
jham: Thanks, I’ve never been compared to ESPN before! :)
drdavis: I have a close on Friday Feb 12 of $15.73, and a close on Friday Feb 19 of $15.33. These are spot prices.
bbartlow: I am not sure that the readers are necessarily represented by the commenters. One of the commodities brokers put out a research note today that referenced the 80 GSR and at the end gave a mention and link to Monetary Metals.
As you may have observed, I hardly fall into the permabull camp (particularly on silver). In addition, I often show why the whole idea of gold “going up” makes no sense. I guess nobody will love me. :P
Actually, there’s a growing community here at Monetary Metals. Something we’re saying is resonating with someone. :)
We will discuss more about our data and methodology. And please also acknowledge my track record. Someone not too long ago asked pointedly if would miss the U-turn in the GSR and only recommend silver against gold once the big move to 50 happened. That was around 75, or 5 points lower. Who else has called and is calling this move in the GSR (among those who take the metals seriously)?
Not sure you are the “only one” to favor gold over silver…
Thx Keith for the replies. I think I have the answer after reading your response to my question & your response to Racoon’s question: GSR will go higher from here, before it goes lower. If I mis-interpretted, please advise.
Gold/silver ratio above 80 !
I think a new article before the sunday/monday update is required explaining how you were nearly the only one to forecast it. Damn I love Amerika so much !
Keith, Yes, I do acknowledge your track record ESPECIALLY when it comes to your predictions about the GSR which have been SPOT On! It is generally accepted in the PM communities that G & S move in tandem, which they do, generally speaking. It is often also said that Silver is like Gold on steroids. IE: when the PM’s are moving upward, Silver usually outperforms gold on a % basis. When PM’s are moving downward (in relation to the dollar) then Gold outperforms Silver.
It’s hard for me to picture the GSR going up appreciably from 80 without the PM’s making a further leg downward. I can’t picture Gold @ 1400 with Silver being @ 15.55
IE: a GSR of 90.
I could, however, picture Gold 900 with Silver @ 10 Not saying that I think PM’s are headed downward from here (because I don’t). Just saying that’s the only way I picture that the GSR could get to 90.
“the gold bugs who need a currency in which to measure the worth of their gold, and in which to take their profit$ when they sell.”
Are Gold bugs really selling Keith?
Do people in Russia, Venezuela, South Africa or even Canada measure their Gold ‘wealth’ in $US?
It reminds me discussion of some kind of so called intellectuals who oppose real world and this of their brains.
Some gold fetishs believe that usd is rotating around gold, while paper fetishs believe gold is rotating around the usd.
It is “worthless” as what is important is that both are money festishs !
UPDATE: As of 2-27-16 the GSR has climbed even further, up past 83:1, just as Keith has been predicting. Great job Keith!
I think I have been following your teachings for about 2 years now. If I recall, during that time frame your models have been showing all along that the GSR should continue upwards, which it obviously has. (From 60ish up to 83+ so far)
My question is this: Did these same models you use predict the fall in the GSR that preceded the low of about 30:1 in spring of 2011?
IE: show that silver was more highly undervalued in dollar terms than gold at the time.
Also, I am wondering what your models look like when a turn around in the GSR happens. The reversal of the direction that the GSR was heading happened rather abruptly in spring 2011. Same thing in ’08 when it turned around from 83ish (sound familiar?) and headed down to 30ish.
I think that what I am getting at is IF or when the GSR turns around & heads the other way, will that be forecast in your models?