
The Silver Blaze Report, 14 Feb, 2016
Again, we had another big drop in the dollar this week. No, we don’t mean against the dollar derivatives known as the euro, pound, etc. We mean by the only standard capable of measuring it: gold. The dollar fell 1.4 milligrams, to 25.1mg gold. Or, if you prefer, 0.1 grams of silver.
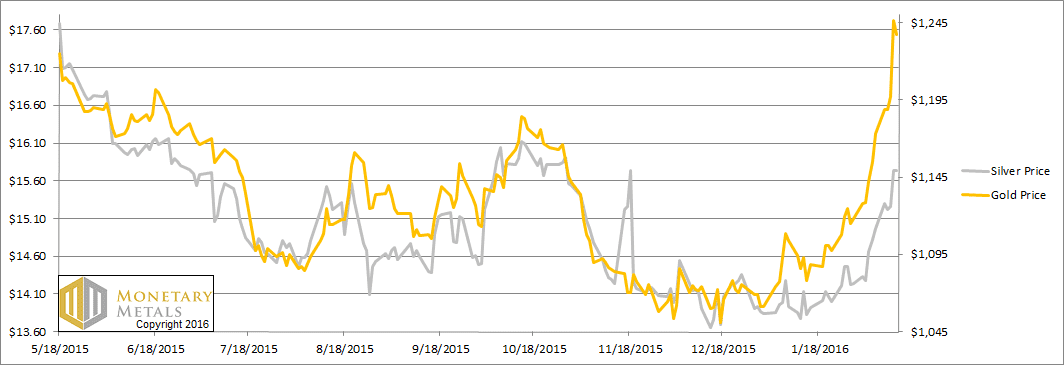
For some reason, it’s obvious when the price of gold in Zimbabwe goes up from Z$118,000,000 to Z$123,700,000 that Zimbabweans are not getting rich. But when the price of gold rises from US $1,118 to $1,237, as it did over the past two weeks, people celebrate. However, gold does not go anywhere, it’s the dollar that mostly goes down. It can go up too, as it did from 2011 through 2015. And now, it seems it’s time for the downward trend to resume for a while.
Of note, silver went up less than gold. Doesn’t everyone know that when gold goes up, silver goes up more? Especially when gold goes up a lot. This is one of those things that you cannot understand, if you think the dollar is the meter stick. If the dollar is the stable unit of measure, then there’s no explanation for this retrograde motion in the two metals. Astronomers struggled similarly with retrograde motion so long as they believed that the Earth was the reference point, and it was the sun and planets revolving around Earth. Once they realized that the Earth went around the sun like all the other planets, things got simpler.
It’s the same with the dollar revolving around gold. It’s simple to explain why silver is underperforming gold. Silver is going down, measured in gold terms. There is no contradiction if both the dollar and silver are going down. There’s even a logic to it, if industrial activity and credit are contracting, it would make sense, wouldn’t it?
Anyways, this was a big week in the prices of the metals. We’re sure everyone is dying to know what is driving these moves. Read on for the only true picture of the gold and silver supply and demand fundamentals…
But first, here’s the graph of the metals’ prices.
The Prices of Gold and Silver
We are interested in the changing equilibrium created when some market participants are accumulating hoards and others are dishoarding. Of course, what makes it exciting is that speculators can (temporarily) exaggerate or fight against the trend. The speculators are often acting on rumors, technical analysis, or partial data about flows into or out of one corner of the market. That kind of information can’t tell them whether the globe, on net, is hoarding or dishoarding.
One could point out that gold does not, on net, go into or out of anything. Yes, that is true. But it can come out of hoards and into carry trades. That is what we study. The gold basis tells us about this dynamic.
Conventional techniques for analyzing supply and demand are inapplicable to gold and silver, because the monetary metals have such high inventories. In normal commodities, inventories divided by annual production (stocks to flows) can be measured in months. The world just does not keep much inventory in wheat or oil.
With gold and silver, stocks to flows is measured in decades. Every ounce of those massive stockpiles is potential supply. Everyone on the planet is potential demand. At the right price, and under the right conditions. Looking at incremental changes in mine output or electronic manufacturing is not helpful to predict the future prices of the metals. For an introduction and guide to our concepts and theory, click here.
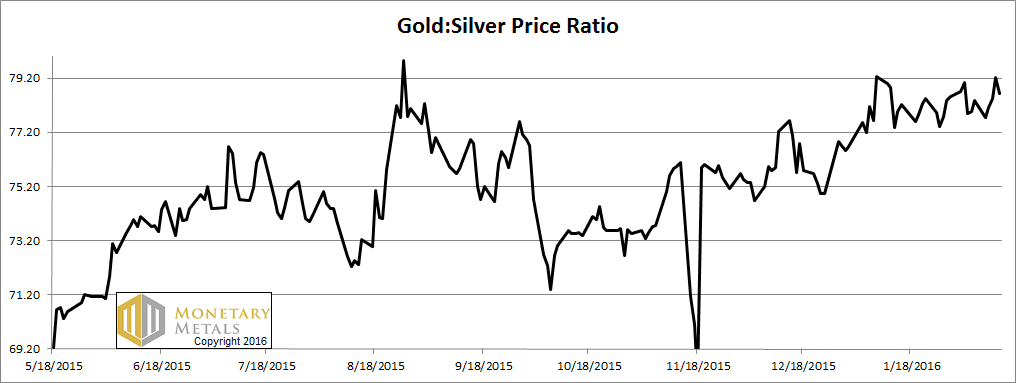
Next, this is a graph of the gold price measured in silver, otherwise known as the gold to silver ratio. The ratio was volatile this week too, but it ended up.
The Ratio of the Gold Price to the Silver Price
For each metal, we will look at a graph of the basis and cobasis overlaid with the price of the dollar in terms of the respective metal. It will make it easier to provide brief commentary. The dollar will be represented in green, the basis in blue and cobasis in red.
Here is the gold graph.
The Gold Basis and Cobasis and the Dollar Price
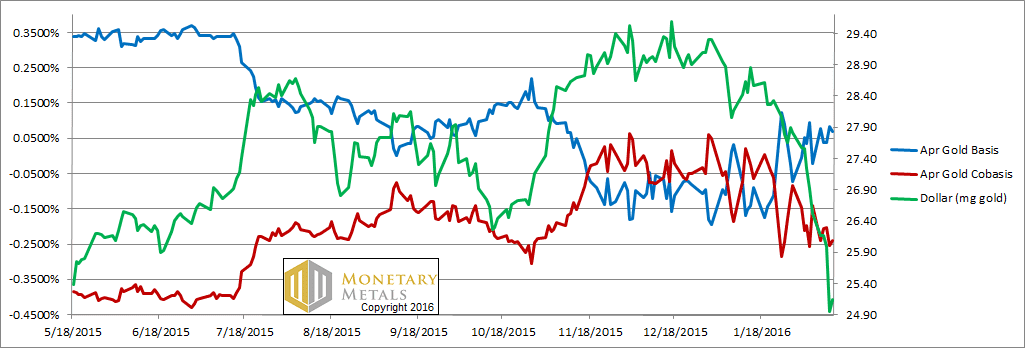
Well, look at that!
There as a gigantic drop in the price of the dollar. We had to change the scale on the chart to accommodate the green line, which would otherwise have fallen off the bottom. But the scarcity of gold (i.e. the cobasis, the red line) did not fall proportionally. It fell, but not the way the price of the dollar did (i.e. the way the price of gold, measured in dollars, rose). The chart therefore understates the drop in the dollar relative to the drop in scarcity.
Last week, the gold price jumped $71 and the cobasis fell from minus 8 basis points to minus 14. This week, the gold price rose almost as much, and the cobasis fell to minus 24bps. These are not especially big moves.
Think of the Sherlock Holmes story, by Sir Arthur Conan Doyle, Silver Blaze. There was a dog in the story that famously did not bark in the night. Well, the gold cobasis did not bark at the rise of the gold price.
Along with the market price, the fundamental price that we calculate based on our proprietary model shot up as well. It’s now about $1,450, up over $200 in the last two weeks.
While we’re not yet alarmed that gold could be withdrawing its bid on the dollar, we would expect the trend of rising gold prices to continue. Unlike the old and longstanding trend, of rising abundance with rising price and rising scarcity only with falling price, this new pattern is a distinct change in the market.
This does not mean that there can’t be corrections along the way. Trade carefully.
Now let’s look at silver.
The Silver Basis and Cobasis and the Dollar Price
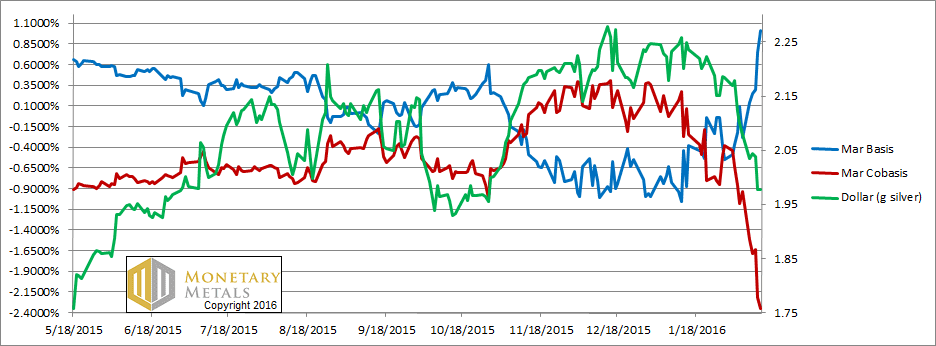
In silver, we had the opposite chart scaling problem. The dollar did not fall enough to require us to lower the bottom of the graph (still at 1.75g). However, we had to lower the bottom for the freefalling cobasis (scarcity) quite a lot.
The cobasis fell from -93bps to -235. Totally off the charts (to abuse a pun that you had to know was coming). We also had to increase the ceiling, for the basis, which rose from -28bps to +101bps. Yes, that’s right folks, there is now contango in March silver!
These are big moves, and they are in the opposite direction than in gold. At the same time that gold outperformed silver.
It is also worth noting that we are at or past the point where we would normally switch from the March to the May silver contract. Why?
The contract roll pushes the basis down and the cobasis up. This is because naked longs have to sell, which means they dump the expiring contract on the bid, pushing it down relative to spot. The typical behavior as a contract heads into expiry—more so for silver than for gold, and earlier too—is basis dropping off the bottom of the chart and cobasis rising into temporary backwardation. Incidentally, this is one proof that manipulation is not occurring as commonly asserted—naked short selling.
Not this time. The buying of silver futures—which means leveraged speculators—was so ferocious this week that it overcame the inherent tendency of falling basis and rising cobasis as the March contract rapidly approaches First Notice Day.
Despite all this, our fundamental price of silver did rise. It’s now almost $14.90.
Should silver speculators take optimism that the fundamental price is rising? We will say maybe for a third week in a row. They should also note that the market price has gotten ahead of the fundamentals. Again.
© 2016 Monetary Metals
Thanks for the informative analysis Keith. It’s much appreciated, given the movements in the market over the last two weeks and gives a sensible foundation of fact for likely future directions. The implications for the gold/silver ratio have certainly changed my outlook, when most mainline prognosticators are howling for a ratio at greatly lower levels.
Thanks Keith! Good stuff as always. It makes life a little more interesting when the shiny takes off like that.
Question: are gold and silver slowly parting ways after a centuries-long relationship, with silver becoming more of an industrial commodity, while gold becomes money again?
Dave: I don’t believe so.
If silver becomes a mere industrial metal, look for its price to collapse as a sign that the accumulated hoard of metal is coming to market as a glut.
There’s no such thing as a glut of money, and I don’t believe there’s such a thing as a glut in silver.
Until such a time when coins (gold, silver & copper) are in free circulation again i.e replacing bank notes & credit cards, silver will not regain its old ratio to gold, indeed until such a time looks likely it is better not regarded as a monetary metal at all and valued simply on the basis of its industrial use.