
Monetary Metals Supply and Demand Report: June 23, 2013
The Gold Basis Report is the only fundamental analysis of gold and silver available. The basis is a measure of availability of metal to the market. When the basis is high and rising, then metal is abundant. When the basis falls below zero, the gold goes into backwardation then that means danger (and likely higher dollar prices).
We don’t measure flows of metal from one corner of the market to the other, on the assumption that one side is the “dumb” money and one side is the “smart” money. We measure the spread between the spot price and the futures contract price. The falling price tells us that demand for gold and silver is lower. The falling basis tells us that those who do buy gold want it now, and are willing to pay a premium to get it now (at least compared to short-dated futures contracts).
Since gold and silver have huge inventories that are not consumed—they are held for monetary purposes—a sign of scarcity in the market is a sign that the dollar is moving towards collapse, when gold will no longer bid on it.
One cannot truly understand the gold market in terms of the quantity of dollars, price charts, or by charts of open interest, ETF holdings, COMEX inventories, etc.
The positive basis (i.e. contango) is disappearing (hence the full name of this report The Last Contango Basis Report). This is a process of gold withdrawing its bid on the dollar. One cannot understand this if one lives in the dollar bubble, looking at the gold “price” as if it were comparable to the price of Apple shares or crude oil.
The “bull market” in gold and silver is not over. We do not recommend that anyone sell his gold now, unless he is using leverage (and we don’t recommend using leverage). When the gold price rises, we don’t recommend selling then, either. A rising gold price gives only an illusion of profit (and the tax man will take a big piece of that).
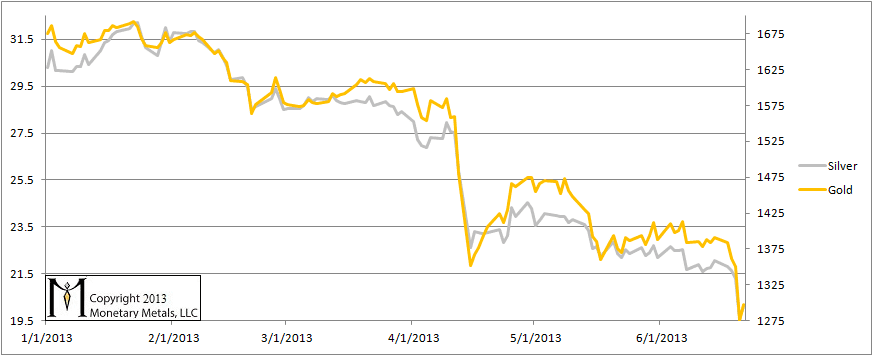
One word describes the price action this week. “Bang!” On Thursday, the dollar prices of both metals hit a new low. Silver was trading well under $20.
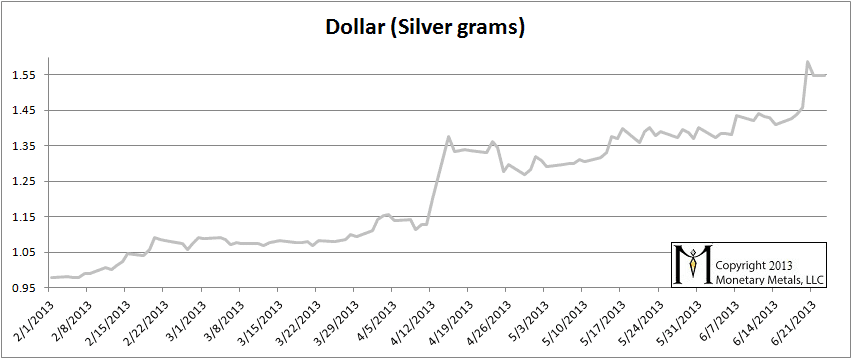
Let’s look at a picture of the price of the dollar in silver. This more accurately describes what is happening. The dollar is getting stronger for the simple reason that debtors are being squeezed. They are scrambling to get dollars. It is not just Japan with a collapsing bond market, but possibly China. If this gets going in any significant way, the price of every asset from copper to real estate in LA will be whacked.
At the beginning of the year, the dollar was under one ounce of silver. Now it is well over 1.5 ounces.
In this report, we have been tracking the temporary backwardation in both metals. It is like a distortion field, as we move closer to each futures contract expiry, that contract is pulled into backwardation. The distortion field is wider for silver than gold. The bid drops, which causes the basis to fall off the bottom of the chart. This could be due to heavy selling, as naked longs must sell before First Notice Day (since they haven’t got the cash to buy the metal). This selling must be on the bid, which presses it down.
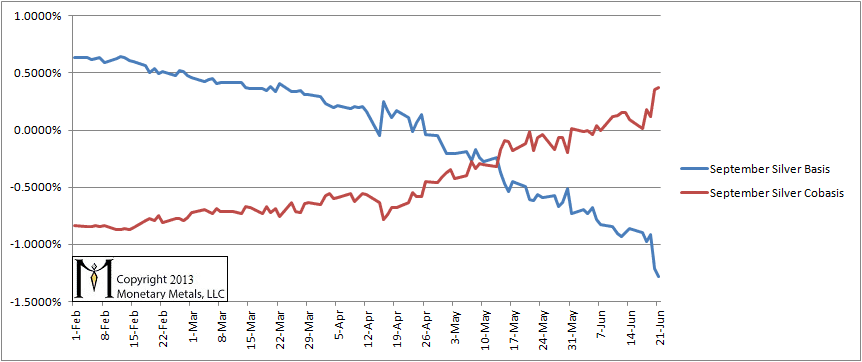
But this does not fully explain the phenomenon. The basis for September silver has been falling in earnest since shortly after the April 15 crash. This is commensurate with a theory of rising scarcity at the lower price, rather than merely reflecting the mechanics of the contract roll.
It is not just that the basis is falling. The cobasis tends to rise at the same time. In the past two Reports, we have been discussing the September silver cobasis. It was backwardated, but just by a smidge (under 0.1%) last week. By Friday, it hit around 0.4%. That is a big move in a short time. And yet the silver price has kept falling.
Think of this as rot in the heart of a tree. It can spread for years, undermining its integrity. The collapse of the tree at the end is “unexpected”. As the financial system rots, people increasingly discount monetary metals for future delivery. Despite the cost to carry gold, it is cheaper to buy gold for delivery in August than it is now.
You could lock in the price now, and not have to come up with the money for a few months. But you would not have to pay interest on this deal. Instead, you will be given a discount. Few people appreciate the significance of this. Just as only a tree surgeon would recognize the rot in the heart of a tree.
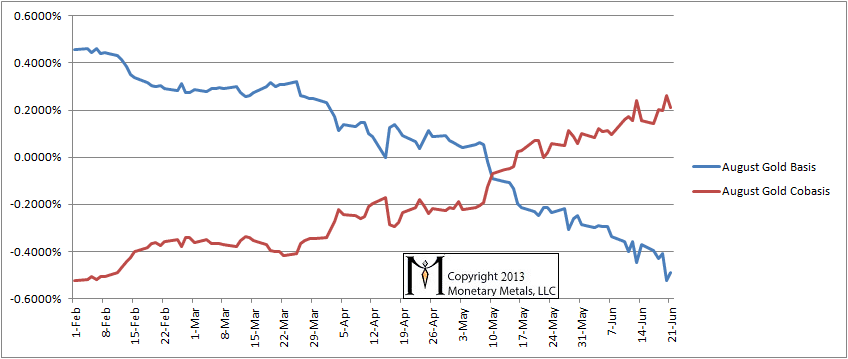
The August basis continues to fall, and cobasis was rising until Friday’s blip higher in price.
Gold Basis and Cobasis
Here is the basis chart for September silver.
Silver Basis and Cobasis
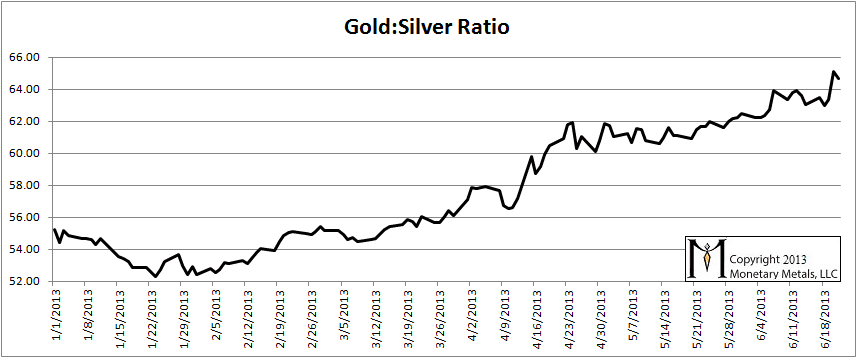
Here is the graph showing the ratio of gold to silver. On Thursday, it spiked up to a new high of well over 65, backing off on Friday’s blip. Our prediction (in a video and articles) was for the ratio to reach at least 60 and maybe 70. At the time, the ratio was 52. We are not reversing our call yet. Should something precipitous occur in Japan, this ratio could spike to an astonishing height.
Gold to Silver Ratio
Let’s shed some additional light on the prediction of a rising ratio. Here is a graph of the gold basis for long-dated futures (the December month in 2014, 2015, and 2016). We picked Jan 23, Feb 25, March 25, April 23, May 23, and June 21 (Friday) for data points to make this easy to read. We have overlaid the gold price on top for context.
Long-Dated Gold Basis
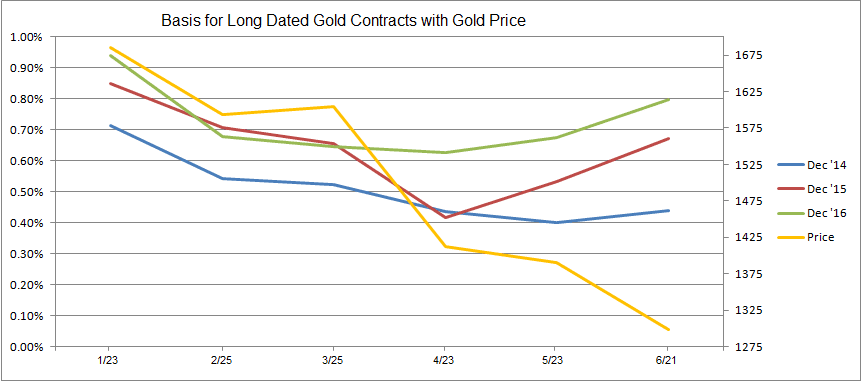
Although all bases were falling from January through April, they have picked up since then. The story told by these long-dated contracts is twofold. First, the bases are now lower than they were in January. That means the market is tighter, scarcer. Second, since the bottom in April, they have been rising. Scarcity is decreasing.
Now here is the equivalent graph for silver.
Long-Dated Silver Basis
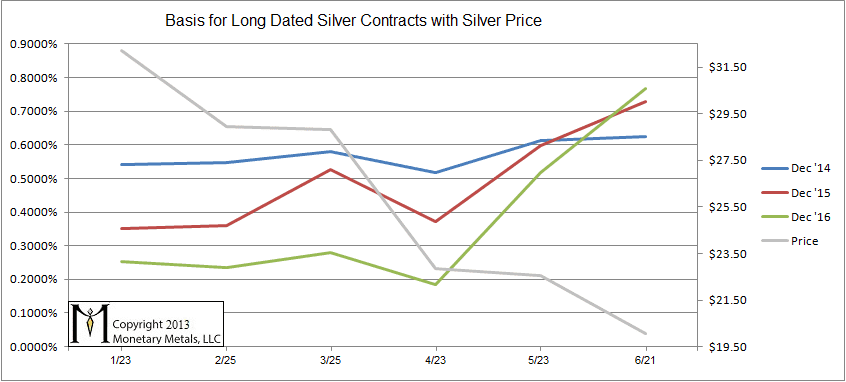
As with gold, the low was April. Unlike with gold, the bases for silver are all higher than in January. Silver has become less scarce than it was. The long-dated futures are interesting, especially in silver, as they are well outside the “reality distortion field” of temporary backwardation.
Thanks for posting this.
Are you saying that the only reason to hold a future contract after delivery notice is to take delivery?
If so, please let me know if I understand this correctly:
The selling by naked longs right before delivery notice pushes down the bid and causes temporary backwardation – but the only reason to buy these contract is to take delivery. But then how can there be a divergence between the bid on the futures that is expiring and the cash price if one is equal to the other in the sense that the only reason to hold a future is to take delivery? Doesn’t this then reflect a distrust in the ability to deliver on futures contracts?
“September silver was backwardated, but just by a smidge (under 0.1%) last week. By Friday, it hit around 0.4%. That is a big move in a short time. And yet the silver price has kept falling”
So silver has recently become more scarce as the price has fallen.
Is this not counterintuitive and perhaps a reason why people think these markets are manipulated especially when high volumes of contracts are dumped in thin overnight markets ?
“The story told by these long-dated contracts is twofold. First, the bases are now lower than they were in January. That means the market is tighter, scarcer. Second, since the bottom in April, they have been rising. Scarcity is decreasing.”
Given the current trend in gold prices, this would seem to be an incredibly bearish indicator. “The dog that didn’t bark in the night” might well have been the sound of a heretofore unknown source of gold getting uncorked. How do you reconcile this with backwardation and other bullish analyses?
petter: one could do the arbitrage: sell physical / buy the expiring future. One would make the spread. To put it in perspective, one could get between 4 and 7 cents per ounce to do this with July silver.
jmf: why is it counterintuitive? A lower price encourages buyers and discourages sellers.
monetary: There are several ways to read it, and clearly it could be interpreted bearishly. Of course, the gold price fell $75 after I wrote that. There are other interpretations that I am still thinking about. More on this topic in the future…
Keith ,
Do you make the comparison (in number of days) of when the basis for each contract became <0, in order to see if the backwardation is speeding up or not ?
THanks a lot for all your analysis
Rueffallais: I posted that statistic a few weeks back in a comment to one of the basis reports and I may have included it in a basis report itself. It has been increasing for gold, which is what I looked at, and I believe for silver too though I did not specifically look.
Further to those interesting points above – I received a letter from our retail bullion vendor apologising for back orders of bullion aged to over two months caused by The Perth Mint’s inability to keep up to current demand.
Given the basis for Gold are now lower than they were in January – the market is showing scarcity and in consideration that since the bottom in April, the basis has been rising – scarcity is decreasing. That seems in conflict with what I understand is heavy demand from private buyers which has caused a back log in delivery of Gold bars –the lower the price the more demand which is behaviour more like a consumable. From your previous articles – would a plausible explanation may be that the current scarcity of bullion is a ‘process’ backlog (adjustment) rather than a market signal?