Light Thanksgiving Week Report 29 Nov, 2015
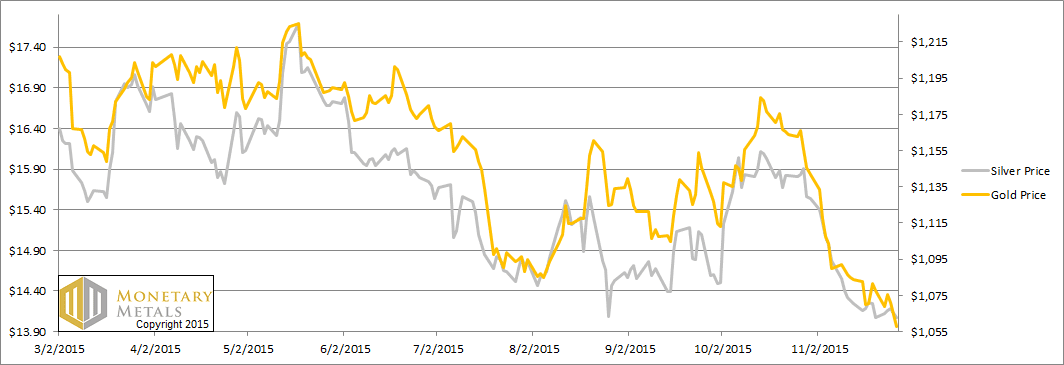
In this holiday-shortened week (Thanksgiving), the price of gold dropped $20 and silver 10 cents. Friday, when the price dropped the most, could not have had much liquidity as most Americans were out of work shopping or partying. Whatever they may have been buying, it sure wasn’t gold.
We might be inclined to take the basis data this week with a grain of salt.
Here’s the graph of the metals’ prices.
We are interested in the changing equilibrium created when some market participants are accumulating hoards and others are dishoarding. Of course, what makes it exciting is that speculators can (temporarily) exaggerate or fight against the trend. The speculators are often acting on rumors, technical analysis, or partial data about flows into or out of one corner of the market. That kind of information can’t tell them whether the globe, on net, is hoarding or dishoarding.
One could point out that gold does not, on net, go into or out of anything. Yes, that is true. But it can come out of hoards and into carry trades. That is what we study. The gold basis tells us about this dynamic.
Conventional techniques for analyzing supply and demand are inapplicable to gold and silver, because the monetary metals have such high inventories. In normal commodities, inventories divided by annual production (stocks to flows) can be measured in months. The world just does not keep much inventory in wheat or oil.
With gold and silver, stocks to flows is measured in decades. Every ounce of those massive stockpiles is potential supply. Everyone on the planet is potential demand. At the right price, and under the right conditions. Looking at incremental changes in mine output or electronic manufacturing is not helpful to predict the future prices of the metals. For an introduction and guide to our concepts and theory, click here.
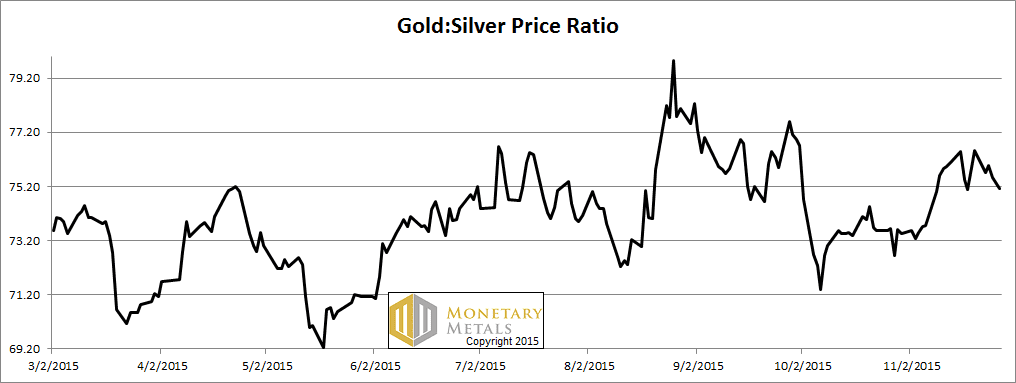
Next, this is a graph of the gold price measured in silver, otherwise known as the gold to silver ratio. The ratio fell this week.
The Ratio of the Gold Price to the Silver Price
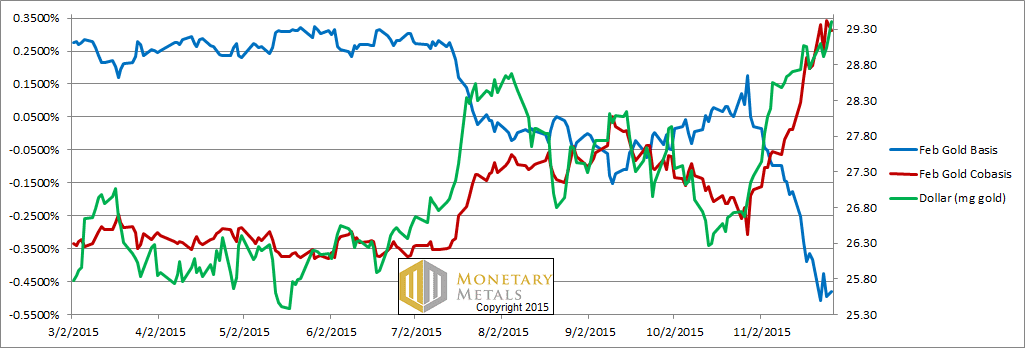
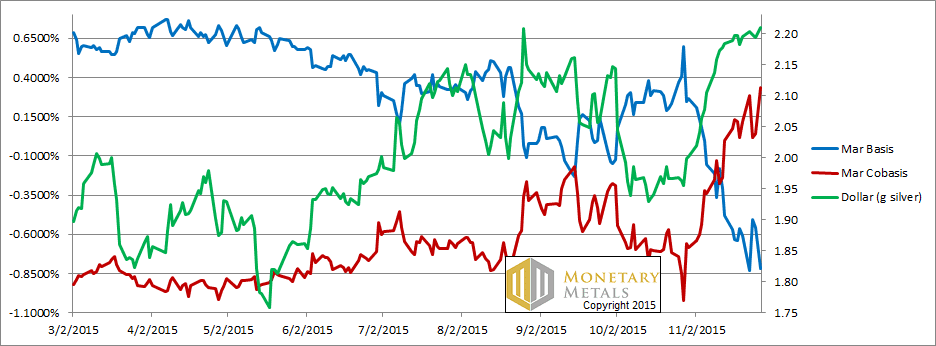
For each metal, we will look at a graph of the basis and cobasis overlaid with the price of the dollar in terms of the respective metal. It will make it easier to provide brief commentary. The dollar will be represented in green, the basis in blue and cobasis in red.
Here is the gold graph.
The Gold Basis and Cobasis and the Dollar Price
The price of gold dropped, but the cobasis (i.e. scarcity) actually fell on Friday. If this day weren’t halfway to a holiday, we would be inclined to read more into it. Monday will be telling…
Our calculated fundamental price of gold fell a few bucks more than the market price, though still about a hundred forty over market.
Now let’s look at silver.
The Silver Basis and Cobasis and the Dollar Price
In silver, the cobasis was down the first part of the week though it rose on Friday ending up on the week.
The silver fundamental, like that of gold, also fell and also more than the market price. It is still a ways over the market price.
© 2015 Monetary Metals


Contrary to most reports, Friday’s trading was anything but light: 18,000 gold futures contracts were liquidated, or 1.9 billion notional. It was a big day in gold no matter how you look at it.
Not only were longs running for their lives, the Commitment of Trader’s Report (“COT”) shows Managed Money (i.e. hedge funds) with their largest SHORT position in history. (To clarify, it’s their largest short position since the CFTC’s began its record keeping in 2006)
Will gold go up? I have no real clue, only suspicions. But I do have a strong educated guess (speculation?) that the dollar — long term — will go down to it’s intrinsic value — which I consider at substantially lower levels, possibly near zero. If that, too, is wild speculation on a par with an option contract expiring this Friday, I am guilty.
Of course, I would take offense to that characterization. It’s never that simple, as an Austrian might have you believe. In that regard semantics have taken over our conversation, unfortunately.
I suspect my of our fellow readers consider modern finance (and the PM’s in general) more like a math equation. The only difference… and the only real unknown, is the actual timing of the dollar’s final value.
Let’s admit this much: Whether gold goes up or down is impossible to say. But it’s entirely possible… and probably… to say that our purchasing power will go down against a variety of things that we buy on a daily basis, as Mike alluded to days ago. (Thank you, Mr. Mike)
So the real question is whether gold can adequately compensate us for that expected decline in our purchasing power over our lifetimes, either one of two ways…. etc.
Regardless, let’s keep this much in mind: While gold has been the standard of value for thousands of years, it does not guarantee a positive result for each investor (or speculator) who takes a pro gold/anti fiat position at disparate times.
The more that volatility abounds, the more that our technical and timing skills will be paramount in our respective outcomes. And yet, timing these long term issues is the very essence of speculation… something we ought not seek out — especially when it comes to our attempt to “save”.
bbartlow: you’re a trooper, thanks for your comment!
I want to clarify one thing. I do not use the term speculator as a pejorative. It is not necessarily wild, reckless, etc. I just think economics needs to distinguish between those who own productive assets to earn a yield, vs. those who buy assets with the hope of a rising price. In a free market, the vast majority are focused exclusively on the former. Naturally, today in a zero interest world, it’s been destroyed and everyone is forced into the latter. I do not blame the player, but the game.
“the dollar — long term — will go down to it’s intrinsic value … near zero.”
“Whether gold goes up or down is impossible to say.”
Let me suggest to you that there is a contradiction here. Has gold gone up over the past century from $20 to $1070? Or is it simply the dollar going down?
As to Friday, the cobasis fell in every contract month. The selling was led by physical metal.
The Dubai Gold and Commodities Exchange (DGCX) plans to launch an exchange traded physically settled spot gold contract on Monday December 14, 2015. They already trade gold futures.
Details in PDF located on their site here:
http://www.dgcx.ae/index.php/en/component/k2/item/649-trdg-2015-035-november-30-2015
A spokesperson for their exchange claimed this 2 years ago:
“In 2013, almost 40 per cent of the world’s physical gold trade came through Dubai and the value of total gold traded through Dubai grew to $75 billion, compared to $6 billion in 2003, and $70 billion in 2012.”
If this claim is remotely true, do you think that monitoring the basis/cobasis on the Dubai exchange has any relevance to what you are trying to measure with your supply and demand report?
It concerns me that your data is exclusively from the CME exchanges which is dominated by alogrithms, derivatives and by transaction volume is essentially a non-delivery (or thinly physically delievered) market.
don’t look here for price satisfaction. consider going back to stochastics. this is an implosion-o-meter. there ain’t no shortage of 400oz bars. never has been. when the madness sets in fully, dubai won’t be a bad place to be. dick cheney bombs alot of people but he’s not likely to bomb himself!
Hi Keith,
Promise me you dont stop with your cobasis reports since I have developed a trading system around it. If you do, please give a pointet on how to retrieve that data. All the best.