Monetary Metals Supply and Demand Report: 15 Sep, 2013
Welcome, we have a new name and a new format to reflect that this is fundamentally about looking at supply and demand in the gold and silver markets. For an introduction and guide to the concepts and theory, click here.
Last week, we said:
“Is the long-awaited, much-discussed silver breakout still on? We don’t think so.”
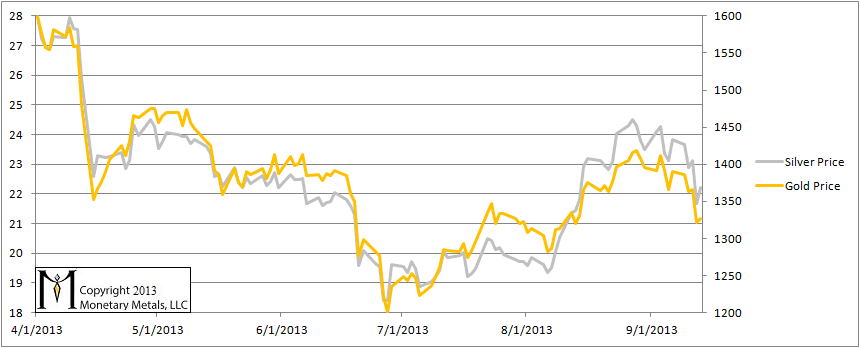
The prices of the metals were down sharply. Was this manipulation? As you’ll see below, the picture in silver is astonishing.
Look for an article we will publish this week, on the topic of why the monetary metals are subject to these otherwise-inexplicable drops in price.
The Prices of Gold and Silver
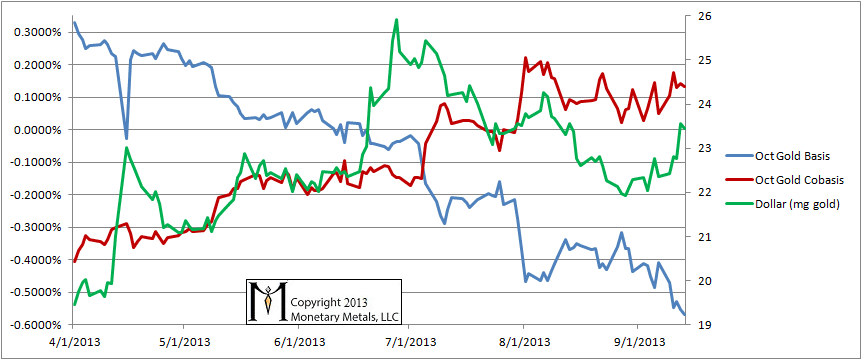
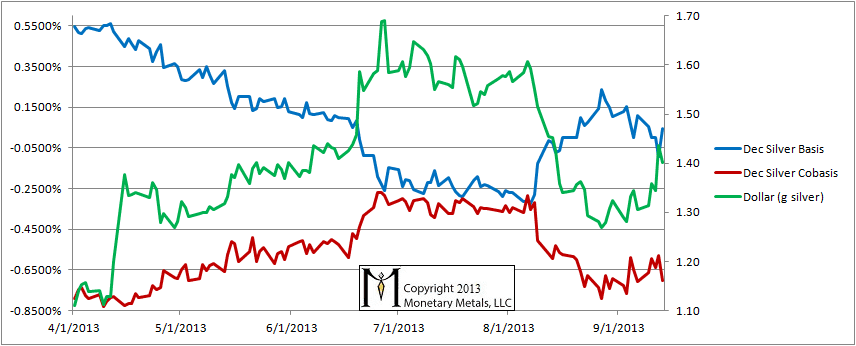
For each metal, we will show a graph of the basis and cobasis overlaid with the price of the dollar in terms of the respective metal. It will make it easier to provide terse commentary. The dollar will be represented in green, the basis in blue and cobasis in red.
Here is the gold graph.
The Gold Basis and Cobasis and the Dollar Price
As the dollar went up in gold terms (i.e. the gold price went down in dollar terms), the cobasis moved mostly sideways. This is not an especially bullish move. If the big selloff had been concentrated in futures, the cobasis should have risen sharply. It did not.
NB: Gold is still in backwardation, though by a very small amount—nothing like the implied divorce between the “paper” gold and “real” gold prices that is frequently discussed in mainstream gold commentaries.
Now let’s look at silver.
The Silver Basis and Cobasis and the Dollar Price
The dollar got quite a bit stronger, measured in silver terms (i.e. the silver price fell, measured in dollar terms). But the basis went sideways and the cobasis fell! This is definitely not bullish. We again reiterate that we never recommend that one short a monetary metal naked.
If there had been a selloff in futures, the cobasis would have risen. This was a selloff concentrated in physical metal more than in futures.
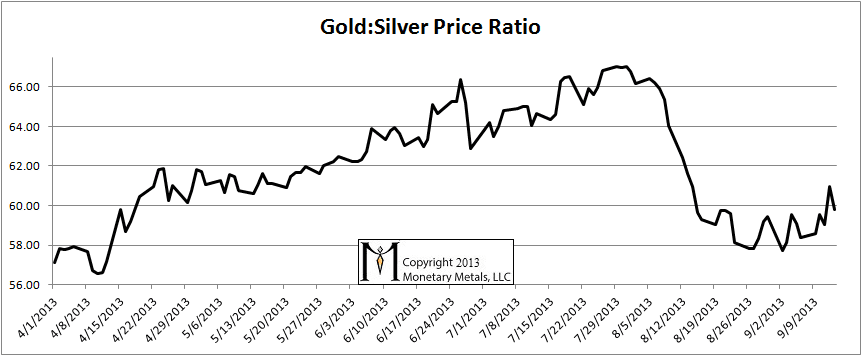
The Ratio of the Gold Price to the Silver Price
Last week, we said:
“While anything could happen in the short term, we think this ratio has likely put in its low and will be heading upwards again, perhaps to break through its high of late July.”
The ratio did indeed rise, though it corrected on Friday. We shall see.


Thank you for this commentary. I really appreciate every update you publish.
Yes, I as well. Thank you.
Greatly appreciated…or should I say “depreciated”?
I like completing my bullion coin collections so lower prices are always welcome for my part.
That’s called a “silver lining”.
Keep up the good work and helping me understand how the commodity metal market works.
Your explanations and commentary have given me a whole new perspective regarding precious metals. Many thanks for that. In trying to understand these somewhat arcane subjects, I assume that the reason the basis and cobasis are not mirror images is because the spreads between the bid and asked constantly fluctuate in both the futures and spot market. Is there any merit to looking at Carry as a percent of Decarry so instead of examining two lines (basis and cobasis), only one chart line is created? Would the rise and fall of this one chart line have any meaning from which buy/sell decisions can be made…or am I completely on the wrong track?