
Monetary Metals Supply and Demand Report: 24 Nov, 2013
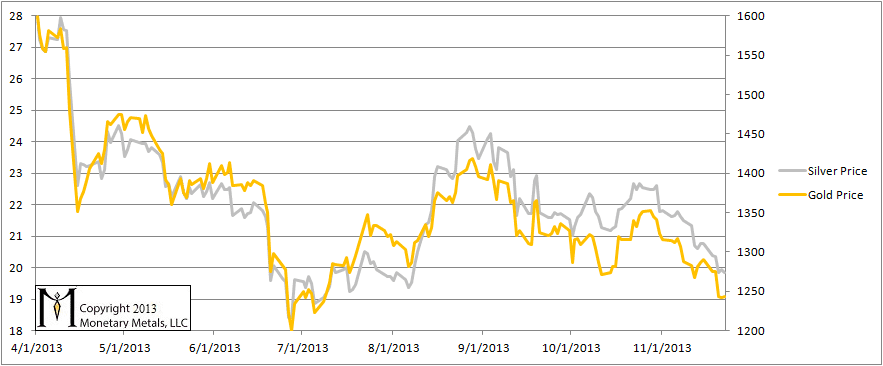
Back on October 27, we said, “this is probably not the gold price breakout you’re looking for.” Gold was $1352 and silver was $22.54. Now, the gold price has dropped $110 to $1242 and silver dropped $2.69 to $19.85. The silver price is down 12% since then.
We prefer to say that the dollar rose this week to 25 milligrams gold and 1.57 grams silver. This is a more objective way of viewing it. It is the dollar that’s going somewhere, certainly not gold. For the moment, it’s going up.
As always, we want to know: what are the fundamentals? The speculators can run for a while in either direction, but reality will inexorably pull the price back in line sooner or later.
We are interested in the changing equilibrium created when some market participants are accumulating hoards and others are dishoarding. Of course, what makes it exciting is that speculators can (temporarily) exaggerate or fight against the trend. The speculators are often acting on rumors, technical analysis, or partial data about flows into or out of one corner of the market. That kind of information can’t tell them whether the globe, on net, hoarding or dishoarding.
One could point out that gold does not, on net, go into or out of anything. Yes, that is true. But it can come out of hoards and into carry trades. That is what we study. The gold basis tells us about this dynamic.
Conventional techniques for analyzing supply and demand are inapplicable to gold and silver, because the monetary metals have such high inventories. In normal commodities, inventories divided by annual production can be measured in months. The world just does not keep much inventory in wheat or oil.
With gold and silver, stocks to flows is measured in decades. Every ounce of those massive stockpiles is potential supply. Everyone on the planet is potential demand. At the right price. Looking at incremental changes in mine output or electronic manufacturing is not helpful to predict the future prices of the metals. For an introduction and guide to our concepts and theory, click here.
Here is the graph of the metals’ prices.
The Prices of Gold and Silver
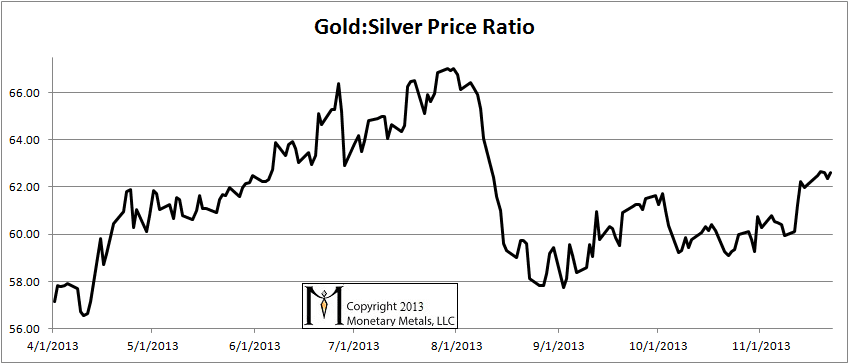
Here is a graph of the ratio of the gold price to the silver price. This shows how many ounces of silver one needs, to buy an ounce of gold. There was about a 1% gain this week.
The Ratio of the Gold Price to the Silver Price
For each metal, we will look at a graph of the basis and cobasis overlaid with the price of the dollar in terms of the respective metal. It will make it easier to provide terse commentary. The dollar will be represented in green, the basis in blue and cobasis in red.
Here is the gold graph. The February cobasis flirted with backwardation this week.
The Gold Basis and Cobasis and the Dollar Price
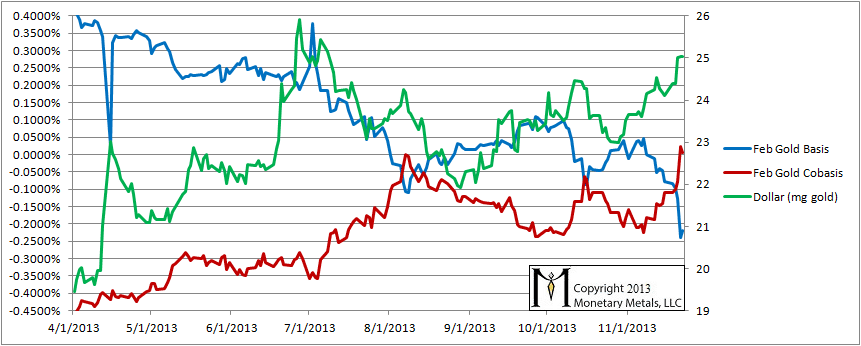
For several weeks, the cobasis has been tracking the price of the dollar. Increases in the dollar price (i.e. decreases in the gold price, measured in dollars) have been accompanied by increases in the cobasis (i.e. increases in scarcity).
This week, both the dollar and the cobasis went up. Fewer people are bringing their gold to market in exchange for the dollar at this more expensive price.
Now let’s look at silver.
The Silver Basis and Cobasis and the Dollar Price
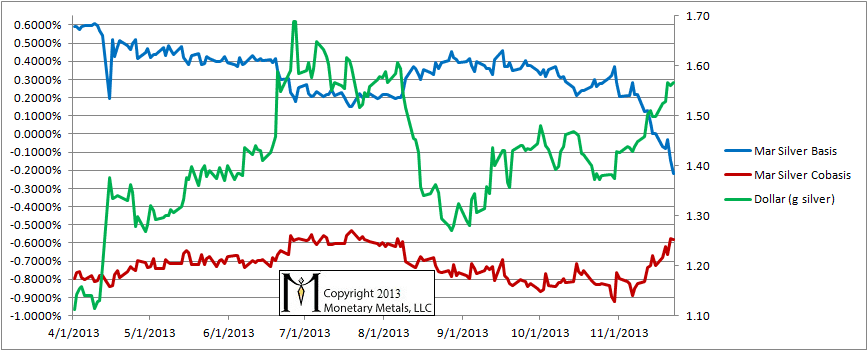
We see a rising cobasis, though far lower than gold in absolute terms. It’s logical that silver becomes scarcer with the dollar at 1.7 grams compared to when the dollar was 1.25 grams. We would not bet on this move being over yet.
© 2013 Monetary Metals
Riddle me this – there seems to be a contradiction in the general supply/demand relationship b/t the USD and gold/silver, (notwithstanding what is revealed by the basis/cobasis) i.e., unlimited USD’s and yet one dollar buys more and more gold. The USD standing as the perceived currency safe haven for the great unwashed seems to play a role in this. Does your analysis denominated in other currencies show anything interesting?
Thanks for your question Freeman.
I argue that the gold price is not a function of the quantity of dollars, yen, euros, etc.
As to the basis, it looks the same in every currency. This is because at any given moment in time, there is an FX rate between the dollar and, say, the euro. So that will give you the euro bid and ask on spot and future gold prices. The basis is the carry expressed as an annualized percentage; the cobasis is the decarry as an annualized percentage.
Yet you argue the gold price is a function of the quantity of gold, in your case a large quantity compared to annual production. You seem incapable of seeing the contradiction.
But Menger said so, so it must be right huh? Couldn’t be a load of bullshit or anything?
JR: Please be courteous in this venue.
I do not argue that the gold price is a function of its quantity or stocks to flows. In fact, I do not argue that gold ought to be measured in dollars in the first place. I argue that price means an objective measurement, which means measured in terms of money, which means gold. At the top of this article, I argue that the price of the dollar is around 25mg of gold, and this is a more accurate way of saying it than to say that gold is $1242.
I do not argue that gold’s price or its value is either proportional to its quantity, or that its price or value are inversely proportional.
I do argue that gold’s bid-ask spread, low volatility, and constant or near-constant marginal utility are related to its high stocks to flows.