
Monetary Metals Supply and Demand Report: 27 Apr, 2014
This was also a shortened week due to Easter Monday, not in the US but in the UK. This week, the prices of the metals were sagging until Thursday morning. Then I believe it was rumors of war in Ukraine sent the prices shooting up. Was this fundamentals suddenly shifting? Read on… First, here is the graph of the metals’ prices. The Prices of Gold and Silver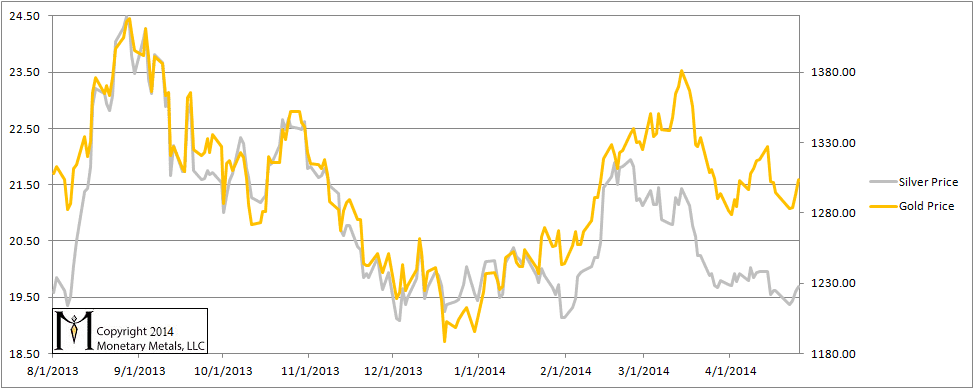 We are interested in the changing equilibrium created when some market participants are accumulating hoards and others are dishoarding. Of course, what makes it exciting is that speculators can (temporarily) exaggerate or fight against the trend. The speculators are often acting on rumors, technical analysis, or partial data about flows into or out of one corner of the market. That kind of information can’t tell them whether the globe, on net, hoarding or dishoarding. One could point out that gold does not, on net, go into or out of anything. Yes, that is true. But it can come out of hoards and into carry trades. That is what we study. The gold basis tells us about this dynamic. Conventional techniques for analyzing supply and demand are inapplicable to gold and silver, because the monetary metals have such high inventories. In normal commodities, inventories divided by annual production can be measured in months. The world just does not keep much inventory in wheat or oil. With gold and silver, stocks to flows is measured in decades. Every ounce of those massive stockpiles is potential supply. Everyone on the planet is potential demand. At the right price. Looking at incremental changes in mine output or electronic manufacturing is not helpful to predict the future prices of the metals. For an introduction and guide to our concepts and theory, click here. Next, this is a graph of the gold price measured in silver, otherwise known as the gold to silver ratio. The ratio moved up slightly. The Ratio of the Gold Price to the Silver Price
 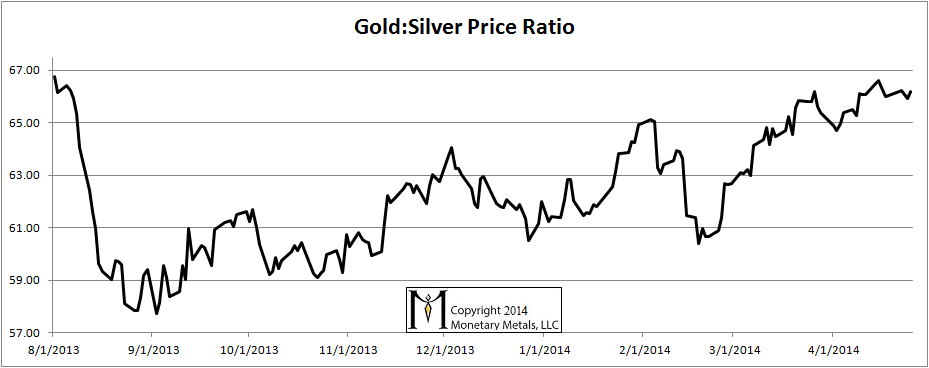 For each metal, we will look at a graph of the basis and cobasis overlaid with the price of the dollar in terms of the respective metal. It will make it easier to provide terse commentary. The dollar will be represented in green, the basis in blue and cobasis in red. Here is the gold graph. The Gold Basis and Cobasis and the Dollar Price
 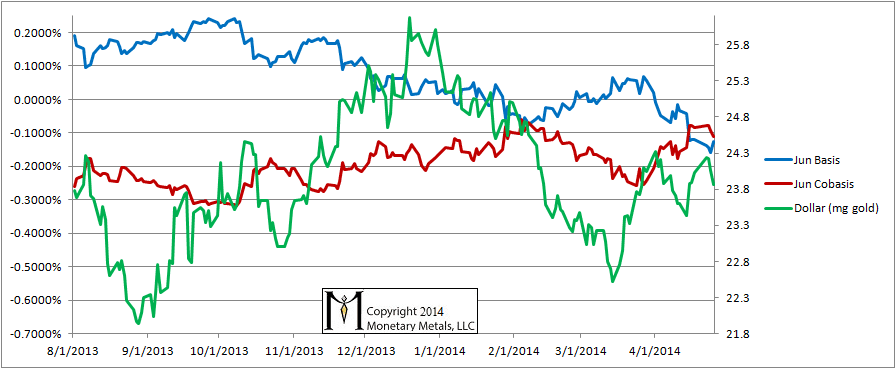 The dollar fell a bit (i.e. the gold price rose), from just over 24mg to just under. And the cobasis fell just a bit. Slight changes in speculative position drove a slight change in the price and a slight change in the cobasis. That said, let’s take a step back and look at the big picture that has developed in gold. Here is a long term graph of the gold bases. It could just as well be captioned “Where’s Waldo?” The Long Term Gold Bases
 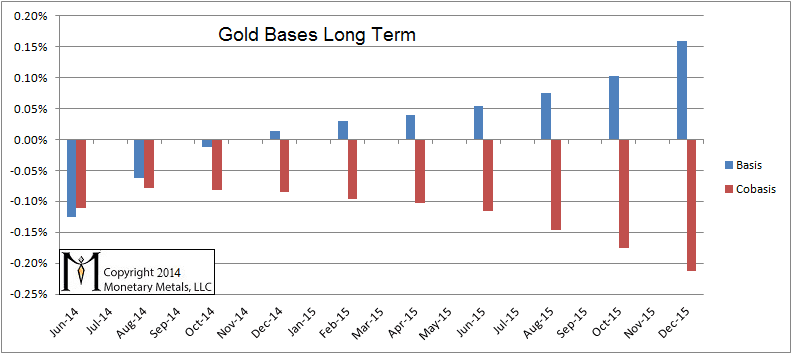 Where is the carry in the gold market?? In December, 8 months away, the carry is 1 basis point! In December 2015, 20 months away, it’s 16 basis points. The cobasis is only -0.21%. Though there is no backwardation (positive decarry) yet, this is beginning to look serious. I don’t mean only that the price could rise. The basis is not in itself a timing indicator, but it shows the market conditions. The stage is set for a 15% move higher in the gold price. If the price overshoots symmetrically from its current position, then we could see a price beginning with 17. The other thing that could occur after the basis is crushed even over the long term is that gold begins to plunge into backwardation across multiple contracts, and contracts that are far-dated. If that happens, we will light the beacons and sound the alarm bells. Now let’s look at silver.
 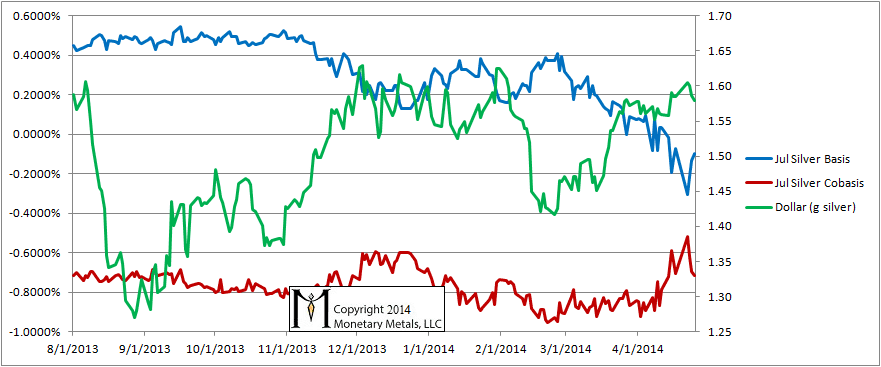 The Silver Basis and Cobasis and the Dollar Price We have switched to showing the July contract, as longs have largely rolled their May contracts. Unlike gold, the cobasis is in the basement. Also, unlike gold the basis rose and cobasis fell on the buying spree on Thursday morning. How long will traders continue to cling to the idea that “if gold goes up, silver goes up more?” We may not be in a precious metals “bull market” right now—i.e. a period of credit-driven speculative buying of gold, silver, and other assets. We may be in a period of credit contraction combined with a real flight to safety. By safety, we don’t mean the typical buying of dollars and Treasurys, i.e. deleveraging. We mean people in various countries buying gold as a protection against bank failures, depositor haircuts, and capital controls. What would you buy if you lived in Ukraine? Not necessarily silver… © 2014 Monetary Metals
Keith,
Great job as usual , the graph Gold bases long term is interesting however without any global vision of how it was in the past it is difficult to draw a conclusion, do you have that kind of graph in the past or another way to put it : where was let’s say for example in April 2013 the base 8 months away (Decem 2013).
Thanks a lot for your work however
Thanks, Keith (Dr. Weiner) for keeping these charts and sharing. GOFO also seems to indicate stress as well in the LBMA.
This is my favorite “Gold” site because of the lack of screaming and hype. Gold to $500,000 or gold to $800 or $50.
There are cracks in the financial system everywhere. I see dead people.
Thanks for your comments.
I just noticed the formatting is messed up on this one. Sorry about that.
Rueffallais: On April 1, 2013 the Basis for the Dec 2013 contract was 38 basis points, and for Dec 2014, it was 53 basis points.
John: Thank you, and I agree, the way to look at the present crisis is one of cracks and fissures opening up everywhere. For example, last year, I wrote of the fissure between euros trapped in Cyprus (“cypros” I dubbed them) and normal euros. Backwardation is a crack in the system.
Dear Keith:
I do not quite understand the basis for a price higher 15% or a$17 handle on the nominal price of gold in US dollars. I understand that the REAL price of gold relative to Commoditites and financial assets could go up, but not necessarily the NOMINAL price in US dollars?
For example, with a credit collapse, since gold is money, gold’s real value goes up relative to all other assets baring cash in the very short term. I sell copper, steel, stocks to flee into cash to pay my bills but then migrate to gold to store wealth.
Thoughts?
Keith,
Thanks for your educational articles. It’s good to find rational and reasoned arguments with commonsense and, as JohnChew stated, without the hype one sees so often.
But I have to ask what is your justification for saying that “the stage is set for a 15% move higher in the gold price”? Where does the 15% come from? What is your reasoning here for the amount?
Thanks,