
Monetary Metals Supply and Demand Report: 9 Nov, 2014
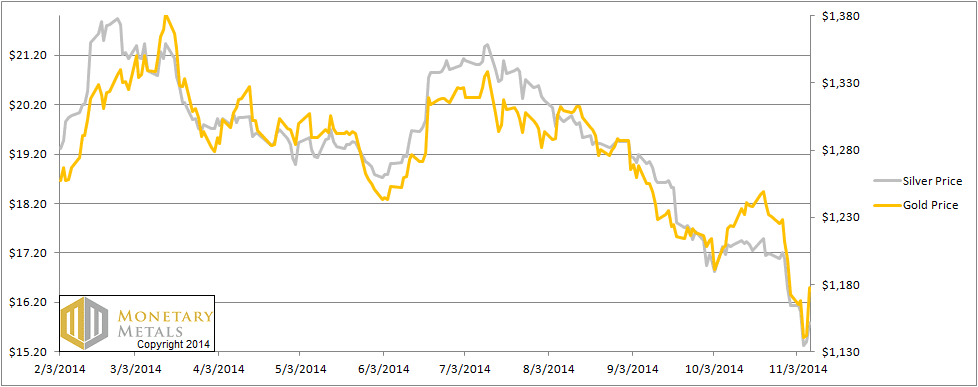
A continuing curse—nay, scorn even!—was heaped upon the gold and silver faithful this week. Those who cling still to faith, faith that gold and especially silver will go up, have been grievously injured. Gold fell far below $1140 on Wednesday. Silver got down to $15. At least that’s how gold speculators—those who bet on the dollar’s decline by going long gold—see it.
In our view, the dollar rose this week, hitting a high over 27 ¼ milligrams of gold on and 2.07 grams of silver.
In the immortal words of Vizzini (from the Princess Bride) it’s inconceivable that the dollar could go on rising. It’s been rising since its low of 16 ¼ mg gold in 2011. Why is it inconceivable? Well, the Fed is printing money. And as everyone knows, the value of the dollar goes down as the quantity goes up. The rising dollar price hasta be manipulation. Gotta.
Italics above indicate what people know that isn’t so (with due apologies to Mark Twain).
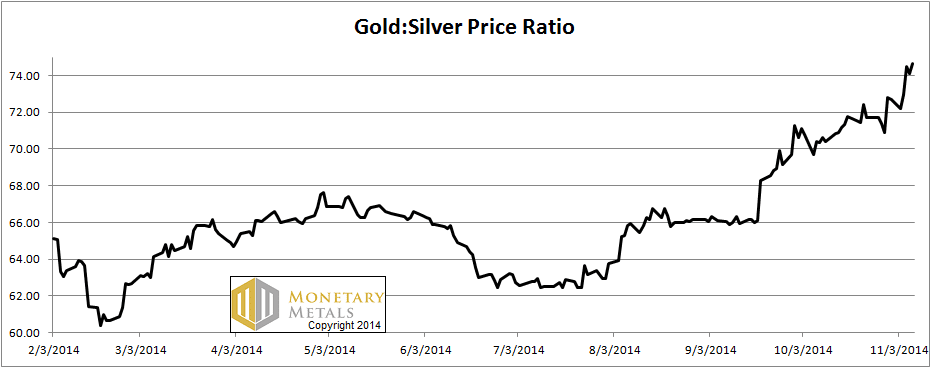
In separate, but related news, the gold to silver ratio, which we said should hit 75, hit 75.43 on Wednesday.
What’s next in the monetary metals? Will silver trade with that 12 handle? Will the ratio go to 80? Will we get more hate mail? Read on…
First, here is the graph of the metals’ prices.
The Prices of Gold and Silver
We are interested in the changing equilibrium created when some market participants are accumulating hoards and others are dishoarding. Of course, what makes it exciting is that speculators can (temporarily) exaggerate or fight against the trend. The speculators are often acting on rumors, technical analysis, or partial data about flows into or out of one corner of the market. That kind of information can’t tell them whether the globe, on net, is hoarding or dishoarding.
One could point out that gold does not, on net, go into or out of anything. Yes, that is true. But it can come out of hoards and into carry trades. That is what we study. The gold basis tells us about this dynamic.
Conventional techniques for analyzing supply and demand are inapplicable to gold and silver, because the monetary metals have such high inventories. In normal commodities, inventories divided by annual production can be measured in months. The world just does not keep much inventory in wheat or oil.
With gold and silver, stocks to flows is measured in decades. Every ounce of those massive stockpiles is potential supply. Everyone on the planet is potential demand. At the right price, and under the right conditions. Looking at incremental changes in mine output or electronic manufacturing is not helpful to predict the future prices of the metals. For an introduction and guide to our concepts and theory, click here.
Next, this is a graph of the gold price measured in silver, otherwise known as the gold to silver ratio. It rose further to 74.6.
The Ratio of the Gold Price to the Silver Price
For each metal, we will look at a graph of the basis and cobasis overlaid with the price of the dollar in terms of the respective metal. It will make it easier to provide terse commentary. The dollar will be represented in green, the basis in blue and cobasis in red.
Here is the gold graph.
The Gold Basis and Cobasis and the Dollar Price
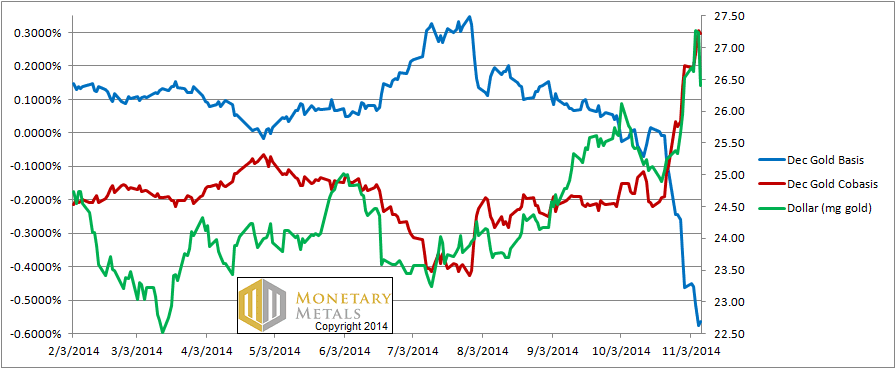
The dollar went up ¾ milligram before subsiding, ending the week down 1/10mg (i.e. the gold price went up). It is noteworthy that the cobasis (i.e. scarcity), which had been rising with the dollar, did not fall with the dollar on Friday.
December gold backwardation stands now at 0.3%. The February and April contracts are not backwardated, but are pretty darned close. There is no sign of the imminent apocalypse, but these developments are definitely … interesting.
We put the fundamental price around $1230.
Now let’s look at silver.
The Silver Basis and Cobasis and the Dollar Price
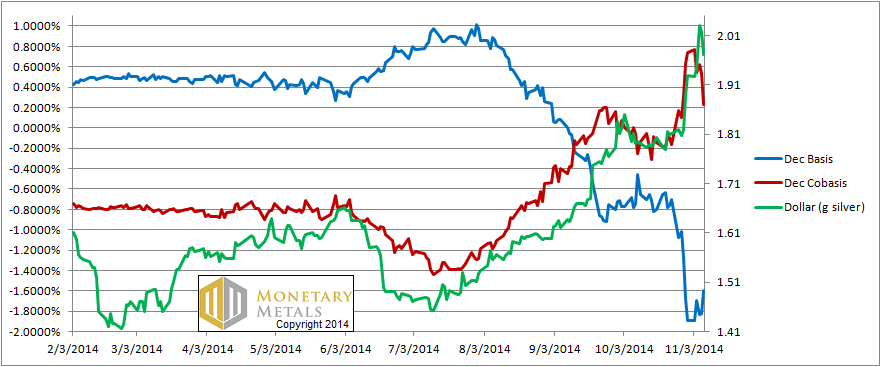
Measured in silver, the dollar rose as it did in gold. However, we see a difference in Friday’s pullback (i.e. rise in the silver price). The silver cobasis (i.e. scarcity) pulled back with the dollar. In gold, fundamental buying (i.e. metal) is pushing up the price. In silver, it may be a bit more biased towards speculative buying (i.e. paper).
It is telling that in Friday’s rally, gold went up more than silver. Also, silver ended the week down from the week before.
The fundamental price of this metal now has a 14 handle on it.
We are not technical traders. But it seems to us that with each passing week, and with each dollar drop in the silver price, the odds of a rally rise. Until the fundamentals change, this rally should not be confused with the big breakout that Darth Vader’s Storm Troopers are looking for. We certainly don’t recommend leveraging up on silver to bet on this. It is not a prediction, more in the way of caution against shorting silver (if we haven’t said it in a while, we NEVER RECOMMEND NAKED SHORTING A MONETARY METAL).
We suspect that 74.6 is not “it” for the ratio. It likely has more lift left in it. Do we dare press our luck and call a ratio over 80? With the caveat of a bull trap rally in silver, and of course the fundamentals could change, we say yes. 80 and maybe higher than that.
Below is a graph showing a fascinating correlation between one measure of credit availability (the spread between junk bonds and Treasurys) and the silver price.
A Junk Bond Spread and the Silver Price
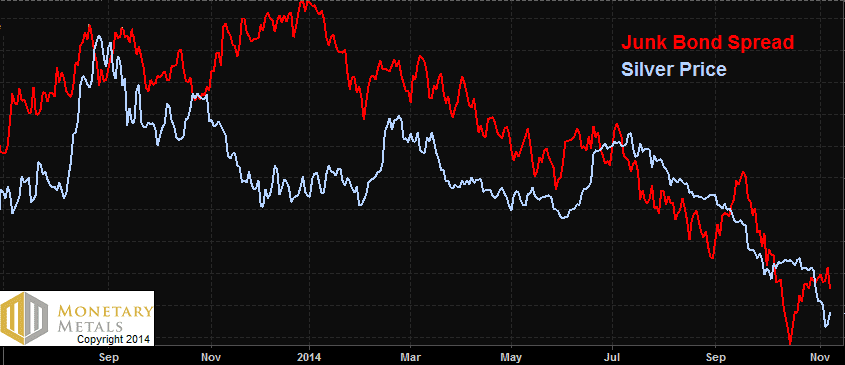
As the spread falls (i.e. credit availability falls) so does the price of silver.
© 2014 Monetary Metals
Gold is still in bearish compared with dollar so gold/silver ratio is increasing, and your analysis is giving about the same results.
By the way, I think that most your “hate emails” are coming from the facts that you rejoice so much with each gold and especially silver fall compared with dollars and when the gold/silver ratio is rising.
Pherisse,
I am not really rejoicing. I am trying to make a point that a lot of people need to hear (and there are new people subscribing every day). Gold does not go up. It’s the dollar that moves.
This touches on the quantity theory of money, which people feel shows that if the dollar supply increases then it must be worth less. And the price of gold “should” go down. If it goes up, there must be manipulation.
“…price” [of an over-printed dollar] /in/ “gold should go down.”
Keith has already inverted his worldview by bookkeeping in gold.
In trying to appreciate the “fundamental” valuation of the dollar, we Americans are stymied by our Legal Tender laws’ monopoly power. Elsewhere, US dollars are not obliged to trade at a 0 or infinitesimal “spread”. Is there a way we can measure how well the dollar is performing the “money function” (vs the monetary metals) by observing the spreads and currency futures markets?
I.e. can we know the basis and the co-basis of dollars (stated as dimensionless percentages, of course)? You’ve already explained that the MM bases do not form an “interest rate” – but is it safe to translate USD interest rates into basis/co-basis numbers for the sake of comparison?
The evidence clearly shows that large scale manipulation is ongoing via JPM and many others. It is to everyone interested in gold accumulation to keep the price low. But look at what the price did earlier this week when the Comex shut down for a half an hour. Sorry, I won’t elaborate more on what everyone already knows. What JPM and others are doing is illegal, but I’m happy to let them keep doing it.:)
Dr. Weiner:
Any articles, books, and/or links that you suggest would be helpful in understanding gold/the gold standard and the the gold market?
Thanks.
John: I recommend my series the Unadulterated Gold Standard:
http://goldstandardinstitute.us/?page_id=277
In addition, I have written lots of material published on this site (more market oriented) and tons on my personal site http://www.keithweinereconomics.com. I also write for Forbes http://www.forbes.com/sites/keithweiner. Each has a different focus.
If the junk spread narrows, it means price of junk moves closer to tbonds. If so, credit is easier. A wide spread suggests credit is tigher, or so I thought. So the junk spread falling in your chart suggests easier credit along with a lower silver price…. I must be missing something?
James: I should have spelled it out more explicitly. I draw the spread the other way (it was JNK – TLT). So it’s the price of junk bonds minus the price of Treasurys (well, using ETFs). As the price of junk bonds falls relative to Treasurys, credit is tightening.
I shared Mr. Toronto’s curiosity about this.
I’m not sure the JNK-TLT spread measures “scarcity” of credit.
The convergence of junk and treasury debt seems to tell a host of other amusing stories. It could be that junk is simply becoming “monetized” (far more liquid), or it could be that dollars are becoming less money-like (junkier?).
I also wondered about this. Anyway – the chart is interesting because it looks like there is a short squeeze in the dollar is underway. Effectively, everyone who is borrowing dollars is short it. If this continues then the Central banks will start to print. Which will not work. At some point – the scheme collapses and with is all the funny Money currencies. This is when gold and silver according to John Exters liquidity pyramid will have rise. For now, gold and silver are falling into the toilet because no one expects inflation. This is a wrong belief – expect a collapse of the banking system and a currency crisis.
I love needing less green papers to trade for my money. No hate mails coming from here.