Silver Goes Foom, Report 24 Jan, 2016
This will be a brief report, as we’re focused on releasing our Outlook 2016 Report which is over 8,000 words of our assessment of the gold, silver, currency, and credit markets. Also, this was a holiday-shortened week (Monday was Martin Luther King Day in the US). But that did not stop the fireworks in silver on Friday. We will look at what happened below.
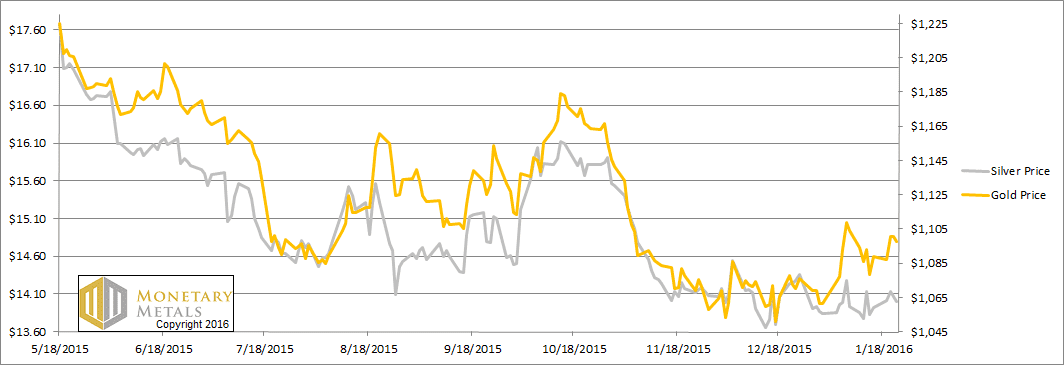
On the week, the prices of the metals were up $9 and 7 cents, for gold and silver respectively. This happened with serious volatility in the stock market, especially on Tuesday and Friday. The stock market ended the week up about 20 points.
Read on for the only proper fundamental analysis of the gold and silver markets…
But first, here’s the graph of the metals’ prices.
We are interested in the changing equilibrium created when some market participants are accumulating hoards and others are dishoarding. Of course, what makes it exciting is that speculators can (temporarily) exaggerate or fight against the trend. The speculators are often acting on rumors, technical analysis, or partial data about flows into or out of one corner of the market. That kind of information can’t tell them whether the globe, on net, is hoarding or dishoarding.
One could point out that gold does not, on net, go into or out of anything. Yes, that is true. But it can come out of hoards and into carry trades. That is what we study. The gold basis tells us about this dynamic.
Conventional techniques for analyzing supply and demand are inapplicable to gold and silver, because the monetary metals have such high inventories. In normal commodities, inventories divided by annual production (stocks to flows) can be measured in months. The world just does not keep much inventory in wheat or oil.
With gold and silver, stocks to flows is measured in decades. Every ounce of those massive stockpiles is potential supply. Everyone on the planet is potential demand. At the right price, and under the right conditions. Looking at incremental changes in mine output or electronic manufacturing is not helpful to predict the future prices of the metals. For an introduction and guide to our concepts and theory, click here.
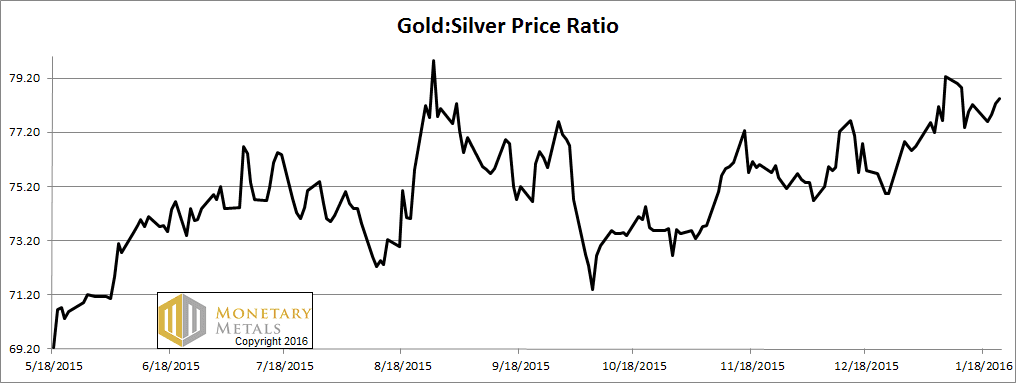
Next, this is a graph of the gold price measured in silver, otherwise known as the gold to silver ratio. The ratio rose this week.
The Ratio of the Gold Price to the Silver Price
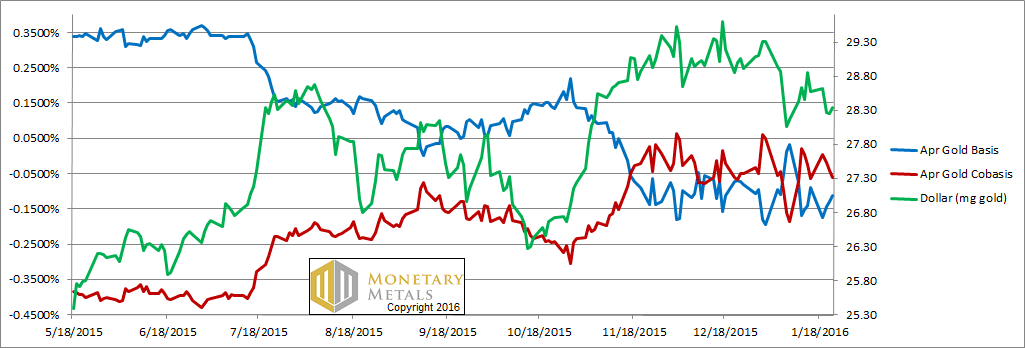
For each metal, we will look at a graph of the basis and cobasis overlaid with the price of the dollar in terms of the respective metal. It will make it easier to provide brief commentary. The dollar will be represented in green, the basis in blue and cobasis in red.
Here is the gold graph.
The Gold Basis and Cobasis and the Dollar Price
Note that we switched from the February to April gold contract, as the former is approaching First Notice Day.
The cobasis (i.e. scarcity) was pretty much unchanged this week, while the price of the dollar fell slightly (i.e. the price of gold, in dollars, went up slightly).
The fundamentals of gold strengthened a bit.
Now let’s look at silver.
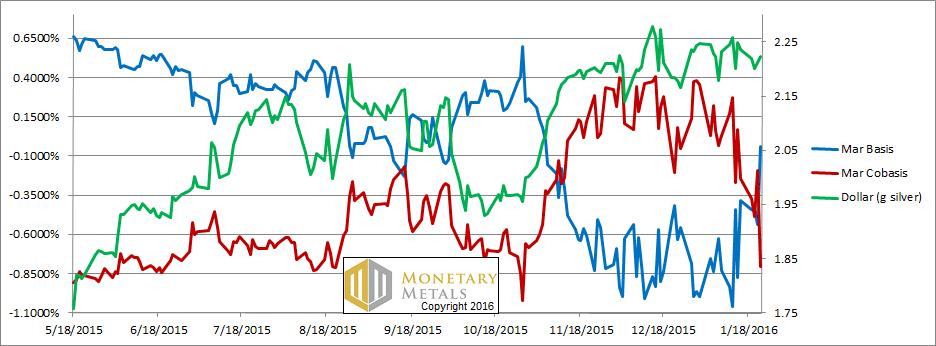
The Silver Basis and Cobasis and the Dollar Price
The price of the dollar in silver terms (i.e. the inverse of the price of silver in dollar terms) did not move much, falling from 2.24 to 2.22 grams of silver (respectively rising from $13.92 to $13.99). That is not the story.
We refer to the spike in the price of silver Friday morning (Arizona time). Overnight through around 2:30am, the price was holding steady around $14.07. Then it began ramping up. By 8:00 it was $14.15, or 8 cents up. Speculators began to feed on the positive energy, or at least on each other. In another half an hour, it spiked up to $14.34, another 19 cents. Serious money (well dollars) are made and lost on moves of this magnitude, especially when people play with the kind of leverage afforded by futures.
Yes, we said speculators. Here’s the proof.
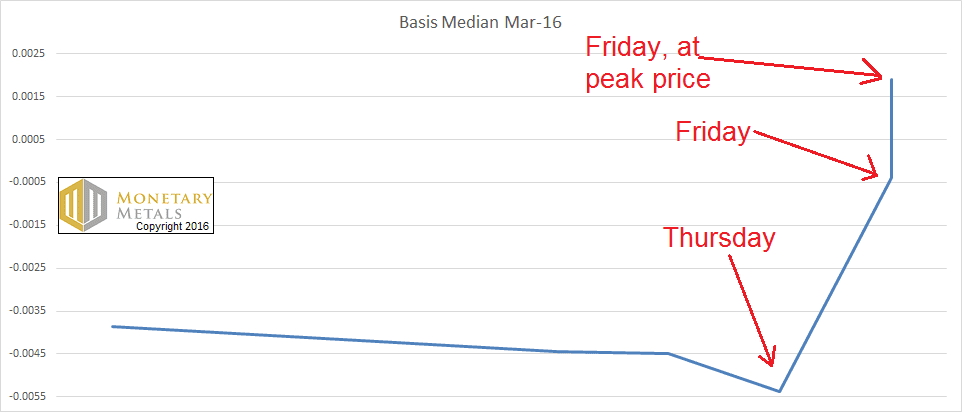
This graph shows Friday Jan 15 through Friday Jan 22. We show two data points for Jan 22.
This is an extraordinary move. The silver basis had been pretty far negative, as it is wont to do this close to First Notice Day. Then FOOM! The basis actually moved up above zero. We have contango in March silver, at least when the speculators had bid up futures so ferociously Friday morning.
Folks, whatever it will look like when the price of silver is ready to start shooting and staying up, this is not it. Quite the opposite. Indeed, the fundamental price of silver fell another nickel.
© 2016 Monetary Metals


It does not appear surprising as comex has been for years the den of speculators for many years and that only few physical hoarders are using it for deliveries.
“Read on for the only proper fundamental analysis of the gold and silver markets…”
Sounds like the braggadocious Donald Trump — this time in the area of precious metals analysis, calling everything but the study of “basis” a worthless enterprise. “It’s my way or the highway”.
I get that speculators create a lot of noise when nothing much is going on.
Then again, isn’t it true that speculators can take silver up to $50 on occasion? Yet, we should believe the speculators should be ignored because they can’t affect the ‘long term’?
Yeah, right.
________________
FWIW — Tech Talk: Unless silver closes above $14.70, risk for a drop to slight new lows remains higher than normal. That opinion is simply based on the resolution of similar patterns in the past. For its part, gold looks solid. The lows appear in, even if we see a drop back to $1050 – $1070, which is unlikely given the vulnerability of the high concentration of shorts, who are already on the run.
In the long run, everything but the study of “basis” IS a worthless enterprise. It’s simple mathematics really although I think the study would be more interesting if the contract value was for 5000 silver eagles instead.