We have consistently been making the contrarian call for a falling silver price and a rising gold to silver ratio for years. This ratio has risen a lot during this time. So are we ready to change our call yet? This being the start of a new year, we wanted to take the opportunity to look at this question in more depth.
In fourth grade math class, Miss Jennifer doesn’t want the kids to just write “42” (with due respect to Douglas Adams). She wants to see the work all written out. It’s not so valuable if we say “silver to $10” or “silver to $100”, without saying why.
This report shows our long division work.
Review of Our Call in 2015
Let’s hold ourselves accountable for what we said last year in our Outlook 2015. The closing gold price for 2014 was $1,184. Our fundamental price that same day was $1,224 (in re-reading that report, we now see that we implied it was $1,214 but the included graph showed the correct value). Silver closed at $15.69 and our fundamental price was $14.35.
We concluded, “There is currently no evidence that scarcity is rising, and thus gold should shoot da moon.” Our bottom line recommendation was, “To those looking to trade, at the moment this report is published you might buy gold for a quick trade. There is no case to buy silver.” We added, “We see no rush to load up the truck just yet.” We said the likely driver for a higher price would be deteriorating credit conditions.
How did we do with these calls?
The gold price has not yet risen to meet our fundamental price. The price was basically down all year after a blip in January. Our silver call turned out to be conservative. Silver closed the year at $13.84, which was below even our number.
Our call on the gold-silver ratio was in the right direction, though the market did not move a lot. It went up about 1.6%.
Our call on credit and when it matters was both on-time and early. On time: the spread between the yield on Treasurys and junk bonds certainly has been widening. See the picture, below.

Source: St Louis Fed BofA Merrill Lynch US High Yield Master II Option-Adjusted Spread
Early: by the end of 2015, the S&P 500 index had only dropped by about 20 points. And, we strongly suspect, credit spreads have just begun to widen (note that the steep part on the right edge of the graph is January 1 – 18 2016). We expect Treasury yields to resume their downward trend (notwithstanding the Fed’s timid little 25 basis point hike in the Fed Funds Rate in December).
As to the yield on junks bonds, well what is a bond of an oil producer worth? When the debt was incurred, everyone assumed that the price of oil would remain over $80. At year’s end, it is $37 (and $28 the time of this writing).
Defaults are coming. It will be interesting to see how the Fed tries to suppress or conceal them. We have read a few articles now suggesting that the Fed is telling banks not to mark commodity producer bonds to market (though we’re inclined to take such assertions with a grain of salt). No matter if the books are honest, or if they are dishonest, the reality is that oil producers (among others) cannot repay.
How Not to Think about Gold
It may seem odd to begin by discussing how not to do it. However, these approaches are very common and many of our readers start with this perspective.
There are several popular approaches to analyzing gold. If you visit many alternative investing or gold sites, you will find conspiracy theories about price manipulation, rumors, out-of-context-factoids, and finally mining production and manufacturing consumption. None of these approaches are helpful. They can confuse long-term holders, and cause traders to make costly mistakes. This is especially true over the past several years.
We have written a lot to debunk claims of price manipulation (here is one article, there are many others on the Monetary Metals site). Broadly, they fall into a few categories. One, central banks are selling gold. Maybe, but what explains the even-larger price drop in silver? The banks don’t have any silver. Two, banks are short-selling futures naked. This would cause backwardation (we discuss backwardation later in this report). It would also cause expiring contracts to move in the opposite direction than they actually do. Three is just what has to be called magical thinking. For example the bigger your position, the more you control the price. How’s that supposed to work? In fact, markets don’t work that way.
We would put rumors, London gold export and Indian gold import numbers, and news into the same bucket. Even when factual, these items are the investing world’s equivalent of an attractive nuisance—they can lure you to financial harm. Most importantly, one should never trade based on what the Fed has done (increase the quantity of dollars) or will do (increase it even more). That is not what drives the gold price. We would think this is obvious now, after years of increasing quantity of dollars and falling gold price, but the belief still persists (more on this later, including a graph).
Finally, there is a lot of information out there on electronics and jewelry consumption, and mine production. However, gold and silver cannot be understood by looking at small changes in production or consumption. The monetary metals cannot be understood by conventional commodity analysis.
This is because virtually all of the gold ever mined in human history is still in human hands (to a somewhat lesser extent for silver). No other commodity comes even remotely close. The US Geological Survey estimated the total gold stocks at 171,300 metric tons at the end of 2011.[1] We believe this understates the reality, perhaps by a large multiple. People have been hiding gold from their governments and tax collectors for thousands of years. Gold has always been the sort of thing that most people would rather keep quiet about. It defies any systematic inventorying process.
In any case, annual production is a tiny fraction of even this conservative number. Reuters reported an estimate of 2012 production of 2,861 tonnes.[2] This is just 1.6% of then-existing stocks. In other words, it would take 61 years at current production levels just to produce the same amount of gold as is now stockpiled. In regular commodities, this same ratio—stocks to flows—is measured in months. We just don’t hoard wheat and oil for the long term, for obvious reasons. Nor even iron or lumber or other durable materials.
If total gold mining is 1.6% of gold inventories, then small changes to that 1.6% are not likely to have much impact on the gold price.
How We Think About It
The implications of this are extraordinary.
All of that stockpiled gold represents potential supply, under the right market conditions and at the right price. Conversely—unlike ordinary commodities—virtually everyone on the planet represents potential demand. If someone offered to pay you 1,000 barrels of oil, where would you put it? The same value of gold is less than a kilogram. You could easily put that in your pocket.
A change in the desire to hoard or dishoard gold, even a small one, can have a big impact on price.
There is no such thing as a glut in gold. Through thick and thin, through rising and falling prices, for thousands of years, the market goes on absorbing whatever the miners put out. Gold mining does not collapse the gold price, as oil drilling or copper mining does, when inventories accumulate. The whole point of gold is that inventories have been accumulating at least since the time of the ancient Egyptian Empire.
Why would people be willing—not just today, in the wake of the great financial crisis of 2008 and unconventional central bank response, but for thousands of years—go on accumulating gold and silver?
There is only one conceivable answer. It’s because these metals are money. Compare gold to oil. The marginal utility of oil—the value one places on the next barrel compared to the previous—declines rapidly. For oil, it falls rapidly because once your tank is full, you have that storage problem—assuming you even use oil at all.
People are happy to get the 1,001st ounce, and accept it on the same terms as the 1,000th or the 1st ounce. It doesn’t hurt that you could carry 1000oz in a backpack, nor that you can find a ready market for it anywhere in the world, from London to Lisbon to Lagos to LA to Lima to Laos.
So if gold is money, then what’s the dollar? The dollar is a small slice of the US government’s debt. It is a promise to pay, though it comes with a disclaimer that says the promise will never be honored. The dollar is credit, whose quality is falling. What does that mean for our discussion of the gold price?
It turns it inside out.
We don’t look at it as a gold price of $1,061. Instead, we firmly insist that it’s a dollar price of 29.3 milligrams of gold. This is not merely semantics. It is a paradigm shift—easy to say, but harder to get your head around. The advantage of this perspective is that you can see the market much more clearly.
If you are in a rowboat, tossing about in stormy seas, would you say the lighthouse is going up and down? If you have a stretchy rubber band, would you use it to measure a steel meter stick? Can you say that the steel is getting shorter, as the elastic stretches? No, the lighthouse and steel are stable but the waves and rubber band are not.
When you say “gold is going up”, you can’t help but think you are making a profit. But if you say “the dollar is dropping” then you realize the truth. Sure you may have more dollars, but those dollars are worth less than they were. You won’t be so tempted to spend down your savings, merely because the value of the dollar fell.
You cannot profit merely by holding gold. You can avoid losses (which is a good thing, in our opinion). We go further. We advocate that everyone calculates his net worth in gold, and measure profit or loss based on gains or losses in gold ounces. If you had 100oz and later you have 110oz, then you got richer. If you went down to 99oz—even if the price of gold is higher, and your gold is worth more dollars—you have suffered a loss. Even if you are not a hundred percent convinced, consider this easy exercise. Just divide your dollar net worth amount by the then-current price of gold. It’s a good discipline to get into.
You can profit from holding silver, when silver goes up. We don’t mean its price in dollars, but gold. For example, if the silver price begins at 0.4g gold and it rises to 0.6g, then you have made a profit of 0.2g or 50%. It is about 0.4g right now, and it was last at 0.6 in 2012.
You can sometimes profit by going long the dollar. It is in a century-long downtrend, but that doesn’t mean there aren’t corrections along the way. For example, the dollar hit a low of 16mg gold in 2011. Since then, its rally has been impressive. It has hit a recent high of over 29mg, a gain of 81%.
At other times, you can profit by shorting the dollar with leverage, for example buying gold futures on margin. Suppose you have 100oz gold, or about $110,000 today. You need about $5,500 in margin per contract to open a position. Your stake of $110,000 lets you buy 20 futures, each representing 100oz. If the price of gold goes up by $60, then you profit of $60 X 100 X 20 = $120,000. At $1,110 per ounce, this is enough to buy 109 ounces. Not a bad profit, if you started with 100. Of course, the risk is extreme if you use leverage like this.[3]
How We Analyze the Gold Market
We think of the market as the coming together of 5 different primary groups.
- Buyers of metal. These are typically hoarders. Unlike buyers of other commodities, they don’t have to incorporate it into a product and sell it to make a profit. So there is no particular price that is necessarily too high, other than whatever their notion of a fair price is at any given moment. It’s worth noting that jewelry manufacturers are mere intermediaries, buying gold to put into product that is typically held owned for a long time by the buyer.
- Sellers of metal. They are dishoarding, for whatever reason. They may think the price has hit a high enough level to attract their greed, or a low enough level to activate their fear. Miners are a subcategory of sellers, though miners are price takers.
- Buyers of paper (e.g. futures). These are speculators, with three key differences from buyers of metal. One, they use leverage. Two (for that reason and others) they have a short time horizon. Three, their exclusive goal is to make a trade for dollar gains.
- Short sellers of paper. Not nearly so big a group as popularly imagined, there are people who take the two lopsided risks of (1) shorting something with limited profit and unlimited loss potential and (2) fighting a 100-year trend. These people are nimble and aggressive and certainly play for the short term.
- Warehousemen, aka market makers. If few people are willing to bet on a rising dollar (i.e. falling gold price), then who sells gold futures? Aren’t futures a zero-sum game, with a short for every long? Enter, the warehouseman. He stands ready to carry gold for anyone who wants future delivery. If you buy a future, you are signaling that you want gold, not to be delivered now, but at some date in the future. For a profit, this group will sell it to you. How do they do that? They buy metal in the spot market and simultaneously sell a contract for future delivery. They don’t care at all about price, as they have no exposure to price. They respond to spread. Suppose they could buy gold in the spot market for $1,100 and sell it for April delivery for $1,108. That is 0.7% for three months, or 2.7% on an annualized basis. It would be pretty attractive in the Fed’s zero-interest world. This is no longer possible in gold. 2015 saw the decline of the gold basis—this spread quoted as an annualized percentage. As of year’s end, the basis for a full year is under 30 bps (0.3%).
It’s important to keep in mind that virtually all of the gold ever mined is in someone’s hoard. There is no such thing as a glut or shortage. However, the market can experience relative abundance and scarcity and the spreads of the warehouseman provide a good signal to see it.
If there is a big spread, such as in our example in #5, that means two things. One, speculators are bidding up futures contracts. And two, the marginal use of gold is to go into the warehouse. This is a sign of abundance.
Normally, the price in the futures market is higher than the price in the spot market. This is called contango. Contango means it is profitable to carry the metal, which is to buy a metal bar and sell a future against it. However, the spread can invert and it has many times since the crisis of 2008. When it is inverted—called backwardation—it is profitable to sell metal and buy a future. Decarrying metal is, by conventional standards, risk free (it’s not, see below). It should never happen in gold, as it is a sign of shortage and there is no such thing as a shortage in a metal which has been hoarded since ancient times. Backwardation is a signal to the warehouseman to empty out the warehouse.
In backwardation, the marginal supply of metal is coming from the warehouse (carry trades are unwinding). Obviously, there is only a finite supply of gold held in carry.
This is the only way to analyze supply and demand fundamentals for the monetary metals. They are not consumed. They have a stocks to flows (i.e. inventory divided by annual mine output) ratio measured in decades. As they’re not bought to consume, nor to incorporate into a product that has to be sold to meet a price point, there is no particular price ceiling.
The five market participants interact to form a constantly changing dynamic. It is this dynamic that we study when we look at spreads between spot and futures, and changes to these spreads. Monetary Metals has developed a proprietary model based on this theory, which outputs the Fundamental Price for each metal. This is updated as the market changes every day.
We have published more on the theory.
Macroeconomic Conditions
For a few years, the market had been in a mode of soft to declining fundamentals for both monetary metals. In 2015, the fundamentals of gold firmed up though silver continued the same trend. There are, of course, price blips. In each blip, we see the same pattern repeated. As price goes up, abundance of the metal rises. Scarcity declines. Then the price subsides and the abundance drops again. It is a pattern of speculators testing the market to see if it has the magic go-juice.
For over three years, we have been calling this publicly. On every silver price blip, a chorus of voices from the precious metals community has cried “break out!” But it has not been so. We have been publishing our data, and our analysis. “This is not the break out you’re looking for,” quoth us (paraphrasing from Obi Wan Kenobe in Star Wars). “The day will come when silver is $50, but today is not that day!” we have also been known to say (shamelessly borrowing from Aragorn in The Lord of the Rings).
Needless to say, this is not the behavior of a silver market price that is shooting, or signaling that it will soon shoot, higher. It is, however, what we have today as the year turns 2016.
Let’s begin our macroeconomic analysis by looking at the gold to silver ratio. It has been in a rising trend since 2011. The key driver is that the making of physical stuff is declining, which lowers demands for commodities. Silver—but not gold—is sensitive to this, so declines with it. Silver is consumed to some extent in manufacturing. Gold’s high price ensures that a lot less is used in electronics, and most of that is recycled.
Along with silver, the prices of the major commodities have been trending down. Some have been doing this for years, for example copper has been falling since early 2011. Oil held its price until July 2014, but is now making up for lost time.
The collapse of commodities is interesting. The gold community still talks about inflation, and the stale idea that the government is lying about inflation. This strikes us as simply incredible. The price drop is so stunning—so epic—that the bankruptcies of many commodity producers are a given. There have already been bankruptcies of trading firms. And there will be bankruptcies of banks, and other financial intermediaries. Inflation, indeed!
The risk of debt defaults has been with us for years, but we think it grows more acute now. A number of high profile debtors defaulted in the first phase of the global financial crisis, including the Icelandic banking system, Bear Sterns, Nortel Networks, and others. Subsequently, Greece defaulted and this led to the banks of Cyprus collapsing. Contagion is very real, in a world where every financial asset is someone else’s debt, creditors are leveraged, debt is rising exponentially, and everyone only wants the borrowing orgy to continue forever.
And now, the world has a new debt crisis to focus on. China. How did China build all those unwanted cities, and all that unneeded capacity in everything from shipping to shopping? They borrowed. The catch is that unused assets do not generate revenue. They cannot pay the debt. So one response is that everyone with any wealth in China is selling yuan to buy dollars.
The dollar is the first and biggest recipient of global capital flows. Gold is second, and silver less than gold (probably much less currently).
Central banks have pushed down the interest rate. They postponed the crisis that began in 2008, though they fixed nothing. We believe the interest rate is now like a snowball pushed partway down the hill. It is rolling and getting bigger of its own weight and accelerating out of control of the person who began pushing it. Interest rates are now obviously pathological. They have long been pathological, but now even the most diehard Monetarist cannot just cling to the stale rationalization of falling inflation expectations. Bonds in several European countries are now trading with negative yields. Are investors paying governments to borrow their money because of expectations of falling prices? If you believe that, then we have a negative bridge to sell you!
This spread between American interest rates and that in other major countries is a fundamental that helps drive currency moves. It pays for someone to borrow in these currencies (yen, euro, franc, krone), exchange them for dollars and buy Treasury bonds. They can pocket the interest rate differential. The drop in the local currency against the dollar is just a free bonus.
The other currencies are unmistakably falling, not even counting the Marxist basket cases like Venezuela and Argentina, or the incipient default cases like Russia. China was the last to join the falling currency party.
Alas, it’s the same falling interest rate trend in the US. The rate is out of the control of the Federal Reserve. To be sure, they cannot allow the rate to rise (notwithstanding any propaganda to the contrary). But that does not mean they want or need it to fall as fast as it likely will begin to fall, when it really gets going.
A falling interest rate is enormously destructive. It creates massive capital gains for bond holders, and the rising bond price is propagated to other markets. These gains are not from rising productivity. They are from monetary policy, which cannot create wealth but merely redistribute it. These gains come at the expense of bond issuers. Bond issuers are, in essence, short their bonds. If you short something and it goes up, you incur losses (we acknowledge that this is not recognized in current accounting practice).
What do you call an environment characterized by falling commodity prices, falling interest rates, and failing debtors?
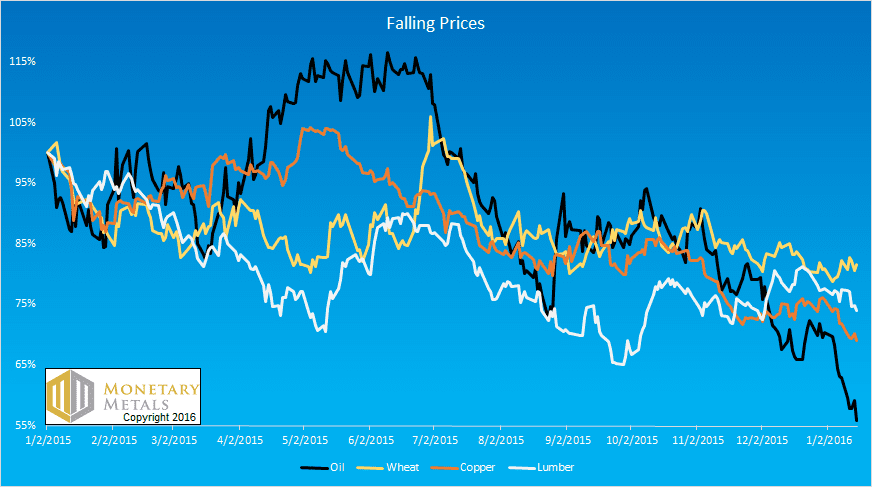
Most people would intuitively call it deflation. Here is a chart showing just the price decline since Jan 1, 2015 (and prices had been falling before that date). It shows four commodities: crude oil (black), wheat (amber), copper (orange), and lumber (white).
This is not a trend that, at the moment, encourages a rapidly rising gold price—and certainly not a rising silver price. It is a trend of dollar debtors getting squeezed, and hence bidding up dollars that have become harder for them to get. This may seem counterintuitive, given the rising total quantity of them. However, this is the fruit of falling interest.
Gold is easy to sell because there is such a small bid-ask spread. Selling other assets involves much bigger frictional losses.
Not the Drivers of the Big Price Move
Speculators view gold and especially silver as just a vehicle to ride, to make more dollars. They can pull the price pretty far, at least for a while. Like stretching a big rubber band however, it gets exhausting to keep up the force. Eventually if they’ve gotten the trend wrong, they must let go. At some point, we think they will fatigue of pushing the gold price down.
If they let go all the way, the gold price certainly could spike a hundred eighty bucks to get to its fundamental. If it overshoots equally far to the upside, then it could approach $1,450. This is not what we are discussing when we talk about a big price move. Speculators putting on, or taking off positions do not cause the really big moves, or durable moves.
We want to know what will cause silver to go back to $35, much less break past $50. What will push gold to $2,000, much less $5,000? The cliché answer is more central bank money printing, which drives another boom and commodity speculation and rising prices for everything. With the inflation trade back on, then the prices of the metals could recover their lost levels of 2011 and continue rising.
We said it last year, and we reiterate now: we would not put capital in harm’s way betting on this thesis.
For one thing, some commodities like oil and iron have structural and likely durable oversupply conditions, thanks to dirt-cheap financing of extraction and refining businesses. The overcapacity was built during a temporary period of high commodity prices, financed at dirt cheap rates thanks to the Fed. These are not conditions likely to return in the foreseeable future. However, now that the capacity exists, it’s not going away. The operators can file bankruptcy but the credits will want to cut costs (and debt service) and keep operating.
Additionally, users of commodities are saturated with debt, and there is not going to be a repeat of the Great Wall-Building Boom of China[4]. Demand is depressed from 2009-2013 levels and there are no drivers on the horizon to overstimulate it again. At the same time, people in countries with collapsing currencies represent declining demand for world commodities—in proportion to the declines of their currencies.
Before we get to our numbers for gold and silver in 2015, we have one other topic to address.
Be Careful What You Wish For
Most gold bugs would love the gold price to rise rapidly to $5,000 or more. We would first like to point out that this means the dollar drops from 29mg to around 8mg. The whole world runs on dollars. Think what will be happening to people, pension funds, insurance, banks, employers, etc. if the dollar drops almost 75% in a rapid spike down.
It is tempting to look around, see the fat cats driving their Ferraris or else being driven by their chauffeurs to bars on the roofs of skyscrapers, jetting around the world, wearing Swiss watches and Italian suits, and think “I’d like to be there.” The fantasy is, “If only gold goes to $5,000 or $10,000, then that will be me.”
We don’t think so. If the price action happens slowly, say over 10 years, it will represent a steady erosion of the dollar and of the world’s capital base. Holding gold will keep you (mostly) safe from that erosion, but will not make you rich.
If it happens rapidly, it will be something else entirely. The collapse of 2008 was ugly, until central banks put it on pause. They agreed to an unfathomable Faustian deal with the devil. When the collapse resumes, it will make 2008 look like a dress rehearsal.
Those bars will be closed. There will be Ferraris for sale cheap, but with refineries and gas stations failing, getting fuel could be a challenge. Getting dollars out of your bank account to buy the fuel could also be a problem. The mood on the street will be ugly, and one may be better off not flaunting a Ferrari openly. Even today, in the relative calm of the current boom, many municipalities are having a hard time keeping up vital services such as police and fire. They will find it much harder when they can’t keep on borrowing.
Something will inevitably happen to remind people that gold is not just for hedging inflation or speculating for dollar gains. To understand, put yourself in the position of a citizen of Cyprus in February 2013. On one Friday afternoon, you had what you thought was a few hundred thousand euros deposited in a bank.
And then, on Monday morning, you didn’t.
It turned out that the Cypriot banks had invested in Greek government bonds. They had long since lost your money but continued to operate in a state of insolvency. As deposits drained away, they got to the point when they could no longer keep up the pretense. People who had their euros locked up in closed banks nervously waited. There were tight limits to withdrawals. And haircuts for depositors—losses shared with other classes of creditors. Virtually everyone on the island was in this vulnerable and terrifying position.
Those few Cypriots who had previously bought gold, found they could easily get on a ship and go to the mainland where conditions were normal. We spoke with a gold bullion dealer in Nicosia, Cyprus. Very few had bought gold. Most did not realize their peril (or want to see it).
The virtue of owning gold, for Cypriots, was not in the hope its price would rise. It was more elemental than that. Gold is not someone else’s liability. It is a lump of metal, which means that it cannot default. It is not subject to a negotiation of the International Monetary Fund, the European Central Bank, and the European Commission. Unlike the so called Troika, gold will not sell you up the river.
If you own it on Friday, you still own it on Monday and it gives you the freedom to do as you please.
Events are coming that will remind people of this. We think these reminders are likely to be very pointed. When hundreds of millions of people in Europe, South America, and even North America eventually, wake up one day to the reality of losses on what they had assumed was money safely in the bank, the buying pressure in gold and silver will be truly ferocious. Notably, the selling will not be comparable. There will be some fools who are eager to book their illusory profits as the price rises. But most won’t be eager to trade their metal for bank deposits of unknown provenance and unknowable risks.
This will likely be a time of exponentially rising price combined with exponentially rising backwardation. That is, the gold futures market will cease to work.
It will be a time of woe, though a bit less horrible for those who own gold compared to everyone else. Not a time of 108th floor bars, $50 cocktails, and jetting off to London for the weekend.
We emphasize that the endgame of the dollar is not imminent. We will continue to update the picture as events inexorably play out.
Last year, we published an article about the coming collapse of the Swiss franc. We were early (though we did not say the collapse was necessarily coming in 2015). This collapse, when it comes, will shake up the monetary system. The yield on Swiss bonds last year was negative out to the 15-year bond. It has improved slightly, though it’s still negative out to 10 years. The franc appears to have reached the end of the road.
Our Numbers
Gold closed the year 2015 at $1,061. The Monetary Metals Fundamental Price closed a bit higher than last year, $184 over the market at $1,246. Here is a graph of the market price overlaid with the Monetary Metals Fundamental Price.
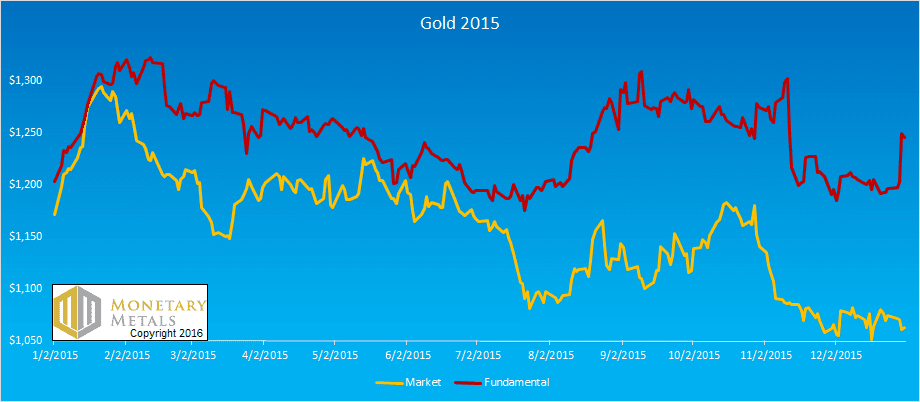
You should be able to see two things clearly. The price of gold rose and then fell, ending a bit below where it started. Also, gold has been underpriced most of the year, with the gap growing in the second half.
Silver closed at $13.84. The Monetary Metals Fundamental Price closed at $14.20. Here is a graph of the market price overlaid with the Monetary Metals Fundamental Price. Silver is a bit undervalued though close to fairly valued. Before betting on silver, we are inclined to wait to see the downtrend in the fundamental reverse.

In both metals, the fundamental price moved around a little. In silver, it ended the year 5 cents from where it started. In gold, it moved up over $40.
The gold to silver ratio closed the year around 76.7. Our model suggests it could be headed over 85. Here is a graph of the market ratio overlaid with the Monetary Metals Fundamental Ratio.

If gold is underpriced, then that means the ratio is underpriced (being gold / silver). 2015 was another year when the ratio was below the fundamental.
Fundamentals can and do change. So what do we expect this year?
Our Call
One approach to the question of price is to draw a line, extrapolating the past trend into the future. We would not advise taking this approach. Since many analysts are doing precisely this (whether they admit it publicly or not), let’s look at the graph for gold.
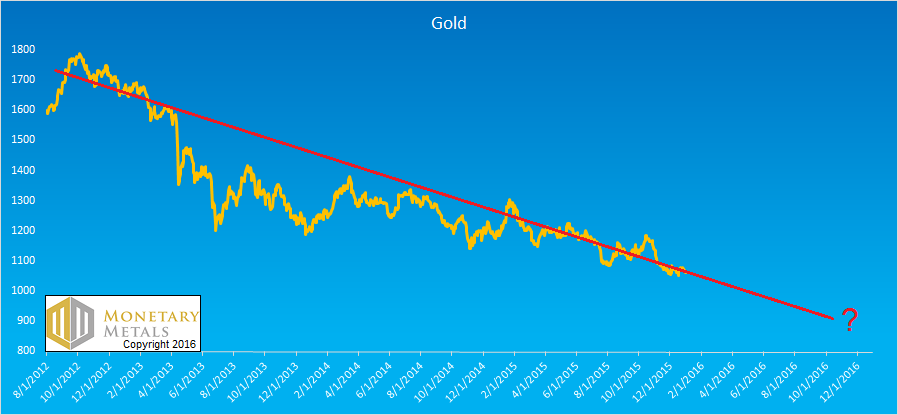
Last year, this line would have given us a gold price around $1000 at the end of 2015, and a silver price (not shown) around $10. This year, perhaps $900 for gold.
We don’t think that most traders would do something this simple (though some mainstream commentators might). Our point is that technical analysis is about looking at the trend. We do not believe that the past trend in the gold price is likely to be a good predictor of the price in the future, because the past drivers of the price will be abruptly replaced with new drivers, at some point in the future.
Another approach is to plot gold against M1 money supply. Here’s what that looks like.

This implies that the price already ought to be around $2,000 and unless central banks put down their keyboards and back away, it will be hundreds of dollars higher by the end of 2016.
We don’t believe this approach, or any approach based on the quantity of money, is valid. At best, one can find correlation without causality. For example, some people thought that there was a correlation between the winner of the Super Bowl and the presidential election (an NFC win was supposed to forecast a Democratic president). We think this chart proves there is no causal link between money supply and the gold price.
Another supposed correlation that we have seen discussed this year is with interest rates (with many believing that rates are headed higher). Here’s the graph of the 10-year Treasury overlaid with the gold price.
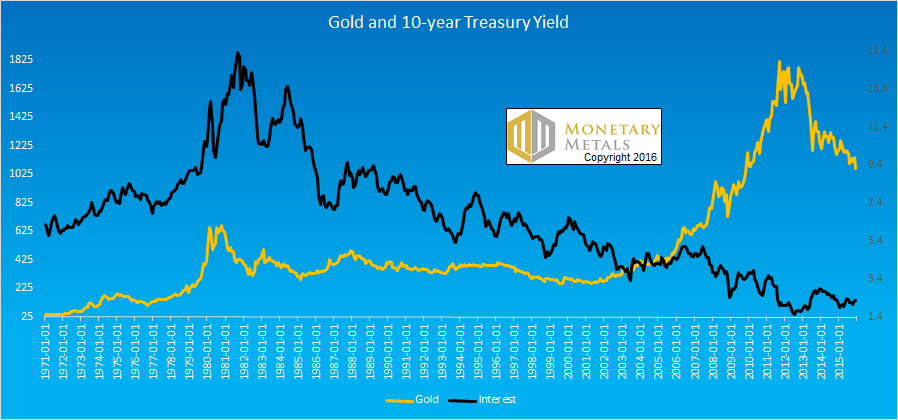
We trust that no reader would want the gold price to be at the level correlated with the black interest-rate line.
Other analysts attempt to calculate a gold price based on inflation—by which they mean rising consumer prices. They say gold should do well in inflation. And, they say that it should be coming any day now because look at how fast the money supply is growing. We don’t think that the money supply drives consumer prices any more than it drives the gold price. The crashing commodity markets over the past few years—notably oil now—should once and for all debunk this idea.
Gold is not purchased for consumption. So even if consumer prices were rising, that does not mean that the gold price must rise. Or, vice versa. Consumer prices are influenced by numerous variables such as efficiency of production that have nothing to do with gold.
Many fall back on the fundamental argument for gold and silver. Paper currencies are now being debased recklessly. Every central bank is a happy and willing participant (the Fed’s cultivated appearance of sobriety notwithstanding). In fact, paper currencies have been falling for many decades. We believe they will all go to their intrinsic value—zero. There’s just one catch.
It doesn’t necessarily have to happen tomorrow morning.
So the past gold price doesn’t predict the gold price of the future. Any correlation between the gold price and macroeconomic indicators is temporary. And, we can’t trade gold based on the premise that paper currencies will meet their final fates. So where does this leave us?
Before we proceed, let’s look at a good (if temporary) correlation with the price of silver and the spread of junk bonds to Treasury bonds. Here’s the graph.
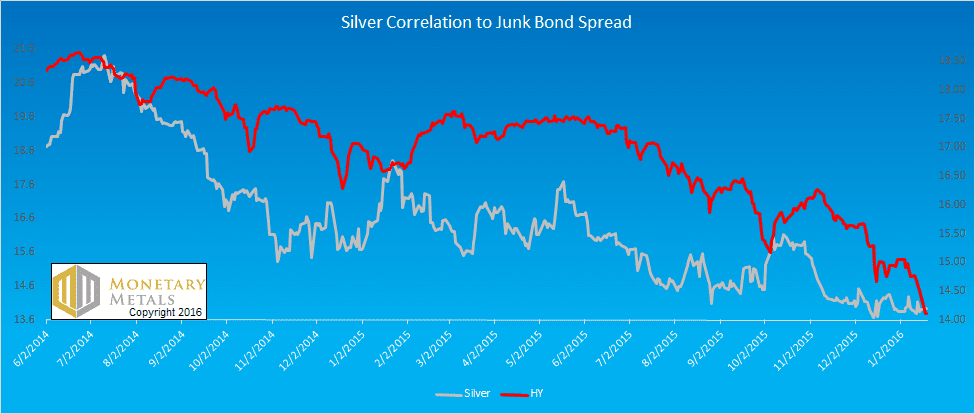
We have plotted the junk bond credit spread inverted, so that lower indicates a higher rate differential for junk compared to the Treasury. These two different lines track fairly well (r^2 correlation = 0.66), certainly better than one should expect to see, for two things chosen at random.
Before we give our view on what it means, we want to emphasize again that interest rate spreads are not necessarily better than interest rates as a predictor of the price of either metal. Indeed, prior to June 2014, there was not much of a correlation between junk credit spreads and the price of silver. After that time, there is. That demands an explanation.
Silver is unlike gold, in that it has both industrial and monetary demand. Junk bonds are a driver of industrial demand, and also an indicator. Driver: when businesses can borrow at dirt-cheap rates, they buy commodities to manufacture their products. They hire people, and those people buy other products. Demand rises for all industrial ingredients.
Indicator: when the economy is slowing, the marginal debtor is the first to show signs that it may default. Rising junk bond interest rates shows this fear.
If one knew that the real economy was slowing, one would expect soft demand for commodities. We see this (recall the graph of oil, copper, wheat, and lumber above). Silver moves with this group, to some extent. See the graph below of the price of oil, measured in silver.
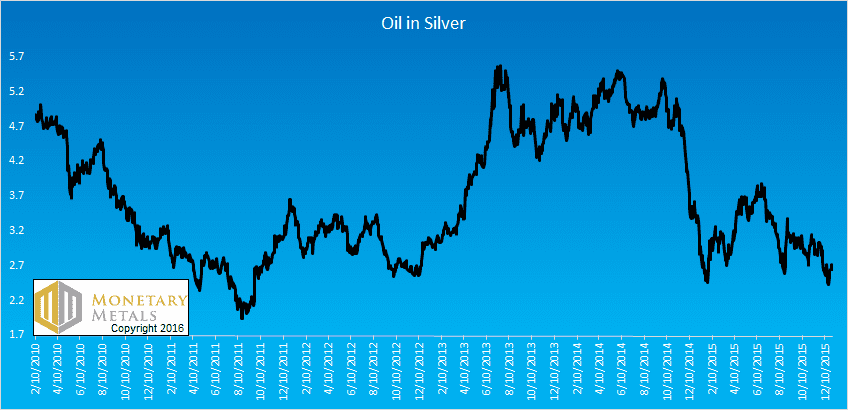
We see that commodities also move considerably relative to silver. In other words—keeping with our thesis that gold and silver are money—the prices of the commodities move up and down. In this period, oil ranged from about 2 ounces to over 5.5.
The first price trough of 2oz occurred in August 2011, when silver traded over $40. So of course every price measured in silver looked low. That is not happening now—quite the opposite in fact—and yet the graph of oil is moving towards that trough again. As of this writing a few weeks into January, the price of oil is again 2 ounces, and about even with August 2011.
It’s not about silver now. It’s all about the collapsing price of crude. Since Q4 2014, oil has been getting cheaper in terms of silver. Oil, wheat, lumber, and even copper are not money but industrial commodities. Demand softens with the slowing economy, the money prices of all commodities are likely to fall further.
This leads to the take-away point. Silver is money. Demand for it as money will arise, and “take over” industrial demand. It will push up the dollar price of silver without particular limit. Silver will behave the same as gold, and for the same reasons. People will choose to own money over being a creditor to a failing institution. They may prefer gold to silver, but in the end they will surely prefer silver to paper.
When there is a long-standing pattern—as there now is in silver since 2011—the first key is to recognize the trend. Silver has been going down. It was just about 1/31 oz gold (almost exactly a gram of gold), and as of this writing is about 1/78 oz gold, or 0.4g gold. The second key is to realize that it is cyclical, thatthe trend will end. And that means to look for the indicator of the end.
We think it should be abundantly obvious by now that the other approaches—to be found every day on gold and silver web sites and email letters—are not reliable. They have predicted at least 53 of the last 0 turns in the silver market.
Our approach is based on the basis (no pun intended—well, OK, just a little pun intended).
The current trend is a reaction to the previous trend. What was that? We call it the inflation trade. After 2008, central banks increased the money supply at an unprecedented pace. Everyone believed that this is supposed to cause prices to rise. So they bid up everything. For example, oil rocketed off its low around $33 in early 2009 and was soon trading at $80. Silver had its low price well below $9 in late 2008. By spring 2011, it hit just about $50, or almost 6X higher.
Then, that trend ended. While the money supply certainly did not collapse, supply and demand fundamentals caused lower prices in one commodity after another. Copper, for example, peaked in early 2011. It is still sliding, at $2 at year’s end. Oil is only the latest casualty.
If people bought the monetary metals because they thought to protect themselves—or profit—from inflation, then it was logical for them to sell the metals when they abandoned this thesis. And, forced by market realities, they did abandon it.
There is currently some scarcity in gold, thus the price should go up modestly, but not shoot da moon. This does not mean that it cannot or will not happen in 2016, but that there is no reason to call it today.
Let’s take a step back and put this into perspective. The inflation trade started in 2009 and began cracking up in 2011. Call it two and a half years, maybe three. The next trend—call it the who-needs-money trend—has been going on for more than four and a half years. We say who-needs-money, because gold and silver are money, and right now no one feels they need it. They prefer government issued paper. Perverse though it may be, this is reality.
We have lots of reasons to expect that this trend will not simply continue forever. Fireworks are starting to explode in the credit markets (though we thought we saw this last year), and some defaults—especially sovereign—could serve as a boot to the head, to people all over the world. The concussion could remind them why they do actually need money.
We may or may not get a rapid change in the prices of the monetary metals, at first. What we will get is a persistently rising cobasis (i.e. measure of scarcity). The pattern will change too. Instead of a dropping cobasis with each price blip, we will see a cobasis that rises with price dips and holds firm or rises on price blips. We will see larger backwardations. When we have had them in the past year or two, they have been a few pennies in silver and under a buck in gold.
What will cause backwardation to increase in magnitude? Backwardation is when the market is offering you a profit to decarry your gold or silver. That is you sell your metal, buy a future, and get a little profit for the deal. Once the contract matures, you get your metal back. Backwardation grows when the reluctance to take this trade increases. What would cause someone to hesitate to decarry their gold?
It is the fear of the counterparty. The CME Group will tell you that their margin procedures ensure that there won’t be any defaults. Every day, dollar cash is transferred from the long to the short in each contract, or from the short to long, depending on the move in the price of the contract. No one is questioning the ability of a major bank to borrow dollars from the Fed to post margin if necessary. But that does not solve the problem of getting gold delivery from a contract. CME cannot assure that contract sellers can deliver metal.
To put it in other terms, the price of a gold or silver future can depart from the price of the metal in the cash market. CME margin process will, of course, apply based only on the price of the future. If the price of a future detaches from the price of metal, that is the market’s indicator that it expects counterparty problems.
Contrary to gold bug propaganda, this price divorce has not happened yet. Even in December 2008, the largest backwardation so far, the February 2009 contract was under 3% annualized backwardation, or less than $4. To a casual observer, the price of the future was still tracking the price of gold metal just fine.
However, and contrary to decades of government propaganda, all is not well in the monetary system. Banks may love the falling interest rate and endless bond-buying of the Fed. It is the same as welfare queens loving the dole. They do not benefit from it, and in fact are harmed. They are weakened, hollowed out. Their liabilities have increased with their assets, but there is a problem. The value of the assets is totally distorted—inflated—by the Fed’s actions. The liabilities, by contrast, are hard.
For example, surely the banks own some of the bonds issued by the shale oil producers. There is no doubt that many of those bonds will default. They were sold into the market when it was inconceivable to have an oil price below $50. What will these defaults do to the banks’ balance sheets?
The actual default events may or may not begin in earnest in 2016 (we are not junk bond analysts), but that is not the point. The market price of the bonds is dropping. That is a loss to the banks who hold them, whether they mark to market or not (and they would be hard pressed to justify not marking the losses based on hold-to-maturity principles, as losses are certainly coming). At some point, these losses will matter.
They may especially matter to gold owners who are weighing the profits they can earn to relinquish their gold for a few months vs. the risks of not ever getting it back.
When backwardation returns to hit the market in a bigger, it will be a bullish signal for the price of the metals. It is interesting that in each case of backwardation so far, the backwardation has been cured by higher prices. This is because some metal was coaxed out of hoards, as some holders valued the dollars more than the gold. But ultimately, higher prices cannot fix the problem which is distrust of all counterparties.
Gold is the only financial asset that has no counterparty.
It is also the only commodity that is bought without regard to price. What is price, anyways? It is the number of dollars that can be exchanged for the good. A dollar is always someone’s liability, a bank’s or ultimately the Fed’s. If your reason for owning gold is to escape exposure to possibly-insolvent counterparties, then a higher exchange rate does not necessarily persuade you to give up your gold in exchange for that paper credit again. If anything in the advanced stages of dollar rot that are coming, it confirms that you were right in your assessment.
Here is our bottom line. To anyone who does not yet own gold or silver, we offer the same advice as always. You should own some, period. Without regard to price.
We think that buying gold now is likely to turn out to be a good deal. We do not promise that the price can’t stay low (obviously, if it can be low now it can remain low or even go lower). We simply see value here.
To those looking to trade, you might buy gold for a trade.
In silver, we’re in a much better situation than last year when silver was overpriced. The price has come down. It’s now close to the fundamental, plus or minus. However, there just isn’t a strong case for buying it now. There is no case for buying silver for a trade. It’s just a roll of the dice.
We do think that it’s increasingly likely that declining credit quality and widening bond spreads will start mattering in 2016 (we said this last year, but we have greater conviction now). This will cause a change in the current trading pattern. Higher gold prices will likely be the result. If the Swiss franc collapses in 2016 (this is not a prediction), then all bets are off.
We said last year that we saw no rush to load up the truck just yet. That turned out to be good advice. We reiterate it today again for silver.
However, gold looks pretty attractive. Maybe don’t back up a full-size truck, but consider a small one.
We will continue to chronicle the changing dynamics in the Monetary Metals Supply and Demand Report every week. Subscribers will be the first to see the shift described above.
It is important to note one caveat. As with equities, fundamental analysis does not help you time the market. Timing is not what we are trying to do. We are doing something that has become unfashionable.
We are interested in valuing the market. As last year proved in silver, value does matter. At some point, it always comes back to the market with a vengeance.
© 2016 Monetary Metals LLC. All Rights Reserved.
[1] http://minerals.usgs.gov/minerals/pubs/commodity/gold/myb1-2011-gold.pdf
[2] http://www.reuters.com/article/2013/11/20/gold-mine-output-idUSL5N0J44T720131120
[3] As they say on those shows on TV when they blow up stuff with dynamite, “don’t try this at home.”
[4] And skyscrapers, cities, rail lines, airports, malls, factories, etc.


Thanks Keith
Are you familiar with the Freegold concept – FOFOA?
Cheers
Great work. To me, yours ist still the best model – i.e. the one with the least level of contradictions – for the price movements (medium and long term) since the breakout of the financial crisis.
One potential contradiction I see is the development of the gold silver ratio. What is your expectations for the gold silver ratio as these metals (however slowly that may occur or whatever the driving events might be) regain their monetary status? Shouldn’t it then also move towards historic levels of the GSR (of say 30 to15) instead of staying with a “fundamental” ration of 80 or above?
Greg
Whats the freegold concept
FOFOA is a prolific blogger on the subject of wealth and gold’s place in the history of it.
Freegold is the belief that with the assistance of “just a little” state power, permanent gold backwardation can be made illegal, and that doing this will not destabilize and distort economics in any important way. Many inspiring thoughts can be found in the years and years of posts on the subject, and its adherents mostly have their hearts in the right place. Their economic thinking seems (to me) to still include some magic, however.
Excellent article Keith! This is perhaps the best analysis of precious metals and the monetary system that I have read. It was clearly a major amount of time and effort on your part. Thank you.–Scott C. Miller
If the US debt is going up but the price of US treasuries are valued at purchace price and the chinese and others are selling US debt. How can the US debt be worth what is/ And how can gold be valued at its current valuation which cannot take into account the real value of us debt on a mark to market basis.
This article is worth its money in gold! Simply amazing and the best analysis i’ve read/heard on gold/silver so far.
Ive read that there are only 1oz of silver to every 300 paper ozs on the comex. If so do at what ratio will there be a rise in the price of silver?
Rational, sober analysis. Well done Keith!
Thanks for so much careful work supporting each point and debunking each hysterical correlation.
Hmmm. So a light truck full? That’d be $17.6M worth, the truck would need a gun turret, too.
Hi Keith, Great work as always.
Is owning PM’s a NO WIN situation?
I used to think of purchasing G & S as being a wise investment. I now think of it as being more like having insurance against collapse of the Monetary System. Not only in this article, but in others I think you have mentioned “Be Careful what you wish for”. Implications being that it may take quite severe economic conditions before the price of the dollar in terms of REAL MONEY goes down. Quite possibly so severe that it would not be something we would want to have to live through.
This line of thinking also begs the question of what is the end game for PM ownership? If gold (priced in dollars) went up to $5,000 slowly would we want to partially divest along the way upward? Probably not since we know where the dollar is ultimately headed. How about if it happened within a week? The only logical end game I can see is trading PM’s for whatever replaces the dollar AFTER the collapse.
Side question: What do you think the G:S ratio would be in a post economic collapse scenario?
last year’s report said “this is a great buying, errrr, exchanging dollars for coins environment!” this year’s report says “ditto!”
Hi Keith. Great article.
I’m struggling to get my head around your thesis on the SNB, the Swiss franc collapsing, and the relationship to the negative yields. Can I paraphrase how I understand this, and you correct me, please?
My (simplified) understanding: “The SNB has failed as an institution in that it no longer provides a currency suitable for its citizens. Since Swiss citizens, just like all other rational citizens, are predisposed to the ‘Time Value of Money’, they will not long accept a money that yields no interest rewards for carrying or lending it. Swiss citizens are thus highly incentivized to sell off their francs for either goods or services, or more likely for currencies from central banks that have not failed, or for hard money gold or silver bullion. When this need to sell is recognized and intensifies, the Swill franc value vs. Gold and other currencies will begin a terminal decline, and will likely accelerate to the point that the SNB and Swiss franc will cease to exist in their present form.”
Thanks for your comments.
David: Freegold is a whole discussion, but suffice to say that if people were free to choose their money they would choose gold. This is not hypothetical, but proven repeatedly in history. So I don’t get the combination of (A) a free market and (B) a price of gold, measured in irredeemable Fed paper. In a free market, the latter would not be accepted by the market.
LTango: I think at the end of the day, the ratio of gold to silver will be a lot lower than 80. However, we’re not at the end of the day right now.
1952: The key to understanding the Treasury is one factor. It is priced in dollars. It pays in dollars. However, the dollar is but a small slice of the Treasury debt. The price of Treasurys in dollars is disconnected from anything in the real world. It can collapse, as it did in the 1960s to 1970s. Or it can shoot the moon, as it has been doing post 1981.
With COMEX, it’s easy to count the contracts as they’re all listed on the exchange itself. However, it’s impossible to count the other side. Contract sellers may have gold elsewhere, they may have gold leases, mining streams, etc.
Racoon: if you mean the price, in this report we say that the price of gold should be higher. If you mean in the bigger picture, well owning gold is not a profit-making asset. It simply avoids the losses incurred by the dollar owners. We will have more to say on this soon…
bgoldman: that is part of it. Why suffer steady, guaranteed losses to hold francs when you can earn positive interest in dollars? Another part is that negative interest incentivizes capital destruction in myriad ways.
Nice analysis, but it still seems to me that the markets are rigged. GATA.org work demonstrates that Central Banks have manipulated the gold price for decades, officially as in the London Gold Pool, and unofficially through the bullion banks. As they point out, how much gold central banks really have is the most closely guarded secret in the world. In order for the US to keep confidence in the US dollar in the face of massive money printing and rising debt, it is imperative that the Federal Reserve and/or Exchange Stabilization Fund suppress the gold price (the canary in the coal mine). As gold flows from West to East (China), the amount of gold left to suppress the price must be getting fairly low. If demand for gold picked up in the West, then it would be game over. Also, the way gold and silver are suppressed in the futures market is by target raids in which tens of thousands of short contracts are dumped in thinly traded markets in a matter of minutes for no other apparent purpose other than to drive price lower. Then when the price is lower, the bullion banks buy back their short positions. The process is referred to as the “wash and rinse” cycle and repeats time and time again. How is this not manipulation? Seems to me that the price of gold and silver will rise when the ability to suppress the price comes to an end.
Keith, What I meant when I drew the analogy between PM ownership & taking out an insurance policy is this: Let’s say, (not so) hypothetically, that I have 75% of the money that I don’t need invested in PM’s. What should I do next? Root for Gold to go to 5000 in the next month? That’s where the “Be careful what you wish For” thought comes into play.
Let’s say I go buy a $1 Million Life Insurance Policy tomorrow. What shoud I do next? Root for my wife to be able to cash in on that policy in the next month?
The “end game” for PM ownership MIGHT be almost as dismal as the Insurance Policy.
Hi Keith,
Nice Outlook, your best yet! Especially liked the Nortel Networks default reference; how quickly we forget that even ‘high-tech’ companies can go bust (as well as banks).
Redeem: I encourage you to scroll back through the articles on this site. We have posted at least half a dozen (plus one video) debunking the claims of manipulation. Those claims just aren’t so, no matter how many times they are asserted.
Racoon: I agree and add (as I always do) that if you own an ounce and the price goes to $5,500 then you do have more dollars, however those dollars are worth less. How much less? They’ve gone down by 5:1. Not only is the world a much-worse place, but you have no more money than before. You still have an ounce!
jtibbs: thanks! :)
Keith.
I really appreciate you looking back at last years predictions and assessing how you did. This is something that not many are honest enough to do, especially not the die hard goldbugs with their manipulation theories that never work.
reading your articles gives a really good sense of gold and the reasons to buy gold and hold gold. Silver however remains kind of fuzzy. I understand that buying sliver right now doesn’t make much sense, but what about holding silver in general. If one already has silver, is there any reason to keep on holding it? I mean, I fully understand why gold is a monetary metal, but is silver really a monetary metal, or just something that tags along behind gold, and kind of is and kind of isn’t.
I somewhat understand gold, but I really don’t understand silver. can you perhaps write something focusing mainly on sliver, so we understand sliver better.
on another note. I really want to encourage you to run a webinar, or a day long presentation in phoenix (which is where you are, I think), or something like that. so we can ask you questions in person.
thanks
Great work Keith. Thank you !
Keith, I see your point. An ounce is an ounce no matter how many pieces of Fiat Paper I can trade it for. Guess I’m still stuck in the mindset of valuing things in terms of dollars.
But can you give us your vision of what a logical “end game” would be for PM ownership? Are you picturing that the collapse of the Fiat Monetary System will eventually happen and then the next Monetary System will be backed by PM’s? In which case we will have neither lost nor gained anything but 95% of “Normal” people will have lost most of what they thought they had.
Perhaps the only logical end game is no end game at all? Just hold your PM’s until the time comes when you really need them. Then trade them for whatever is the currency en vogue at the time & make your purchase. I guess that’s a far more pleasant end game than the end game for my Life Insurance Policy ;-)
Regarding this comment:
What we will get is a persistently rising cobasis……….. The pattern will change too. Instead of a dropping cobasis with each price blip, we will see a cobasis that rises with price dips and holds firm or rises on price blips.
If you apply your model using currencies other than the US dollar are we seeing this already, and what does it mean?
From what I understand if this happens in the US dollar, it is the “end game” or withdrawal of the gold bid on the dollar and currency collapse.
I’m thinking plugging in the black market rate of the Venezualan bolivar indicates a collapse in that currency.
What about the Canadian dollar, South African Rand, Russian ruble or Norwegian krone?
It would be good to hear some commentary on the application of this methodology to gold and silver priced in other currencies.
Thanks for your work, Keith.
Please correct my understanding of silver vs. gold
– unlike gold, a substantial amount of silver is consumed not hoarded
– the world inventory of silver is much lower than it was 50y ago; silver (unlike gold) has been consumed faster than it has been produced in that time
– the current world silver inventory is about the same as gold (5 billion oz; although estimates of this number vary from half to 4 times that figure) despite silver production being multiples of gold
production
– current consumption less production of silver teeters around zero
– actual physical silver could run out entirely (especially at these low, uneconomic prices)
– silver is indeed a weird hybrid between a monetary metal (which it was until the late 19th century) and industrial metal (that is consumed just like copper, nickel or tin) and therefore more price dependant on production.
Keep up the great work, I’d love to read an article focussing on silver
Dr George
Brilliant! Excellent analysis Keith.
Thanks for your additional comments.
greenapple: I plan on more seminars. Stay tuned. :)
I think silver is still very much a monetary metal, and like gold, it’s aboveground stocks are likely underestimated very badly.
If we do not change the system, then I think the end game is collapse. I discuss it here: http://goldstandardinstitute.us/?p=525 It is going to be a horrible time. Yes, holding gold may give you options that others don’t have (e.g. to bribe a guard to escape somewhere) but no one wants to live through collapse.
I hope to drive something else, a graceful transition to the gold standard. In that case, what you have *is* money.
Pizza: the other currencies will all collapse, and then the dollar last. Bolivar may be collapsing right now. Canadian probably has some years left in it. I wrote an article about a year ago arguing the Swiss franc will collapse (though not necessarily calling for it to happen in 2015).
pbevan: Some silver is consumed. Hopefully, not so much that it is demonetized. Silver plays an important role. Not just for small change (which may be rendered less important by electronic gold programs) but for the small saver. Silver is the most hoardable good for someone who is setting aside 10% of his weekly wage. A portion of hoarding needs to be in physical metal at home, and silver is better for this purpose for most wage earners.
Thanks Keith
So you agree there is probably about 5 billion oz. (1 billion oz. = 31.1 t) of both gold AND silver above ground – less than 1 oz. of each per person on the planet. The new monetary system is going to be interesting!
Also, I understand there is about 750moz. of silver mined each year + 250moz. recycled etc. = 1 billion oz.
Of this, some 650moz. is consumed – this is a bit more than some…
Please don’t take this as criticism – love your work… and your discussions.
Great article Keith.
In economic collapse you will be selling some Gold not for worthless fiat but for other depreciated hard assets, houses, land etc. as they return to real valuation once the debt cycle resets. In Australia real estate has out performed Gold about 10x Gold miners 25x over the last 25 years. Valuation wise swapping some real estate for Gold now is prudent insurance, those with Gold already relax and wait.
Bravo! Your finest work.
‘What we will get is a persistently rising cobasis. The pattern will change too. Instead of a dropping cobasis with each price blip, we will see a cobasis that rises with price dips and holds firm or rises on price blips.’
Question is, do movements in the cobasis precede price movements, or merely move simultaneously with price? ie, can the cobasis be used to predict price movements? In any timescale?
Also does historical examination of the cobasis predict price movements such as the rise in gold from 2000 to 2011 – and especially the subsequent bear market, which caught many off guard?